Statistics - Introduction
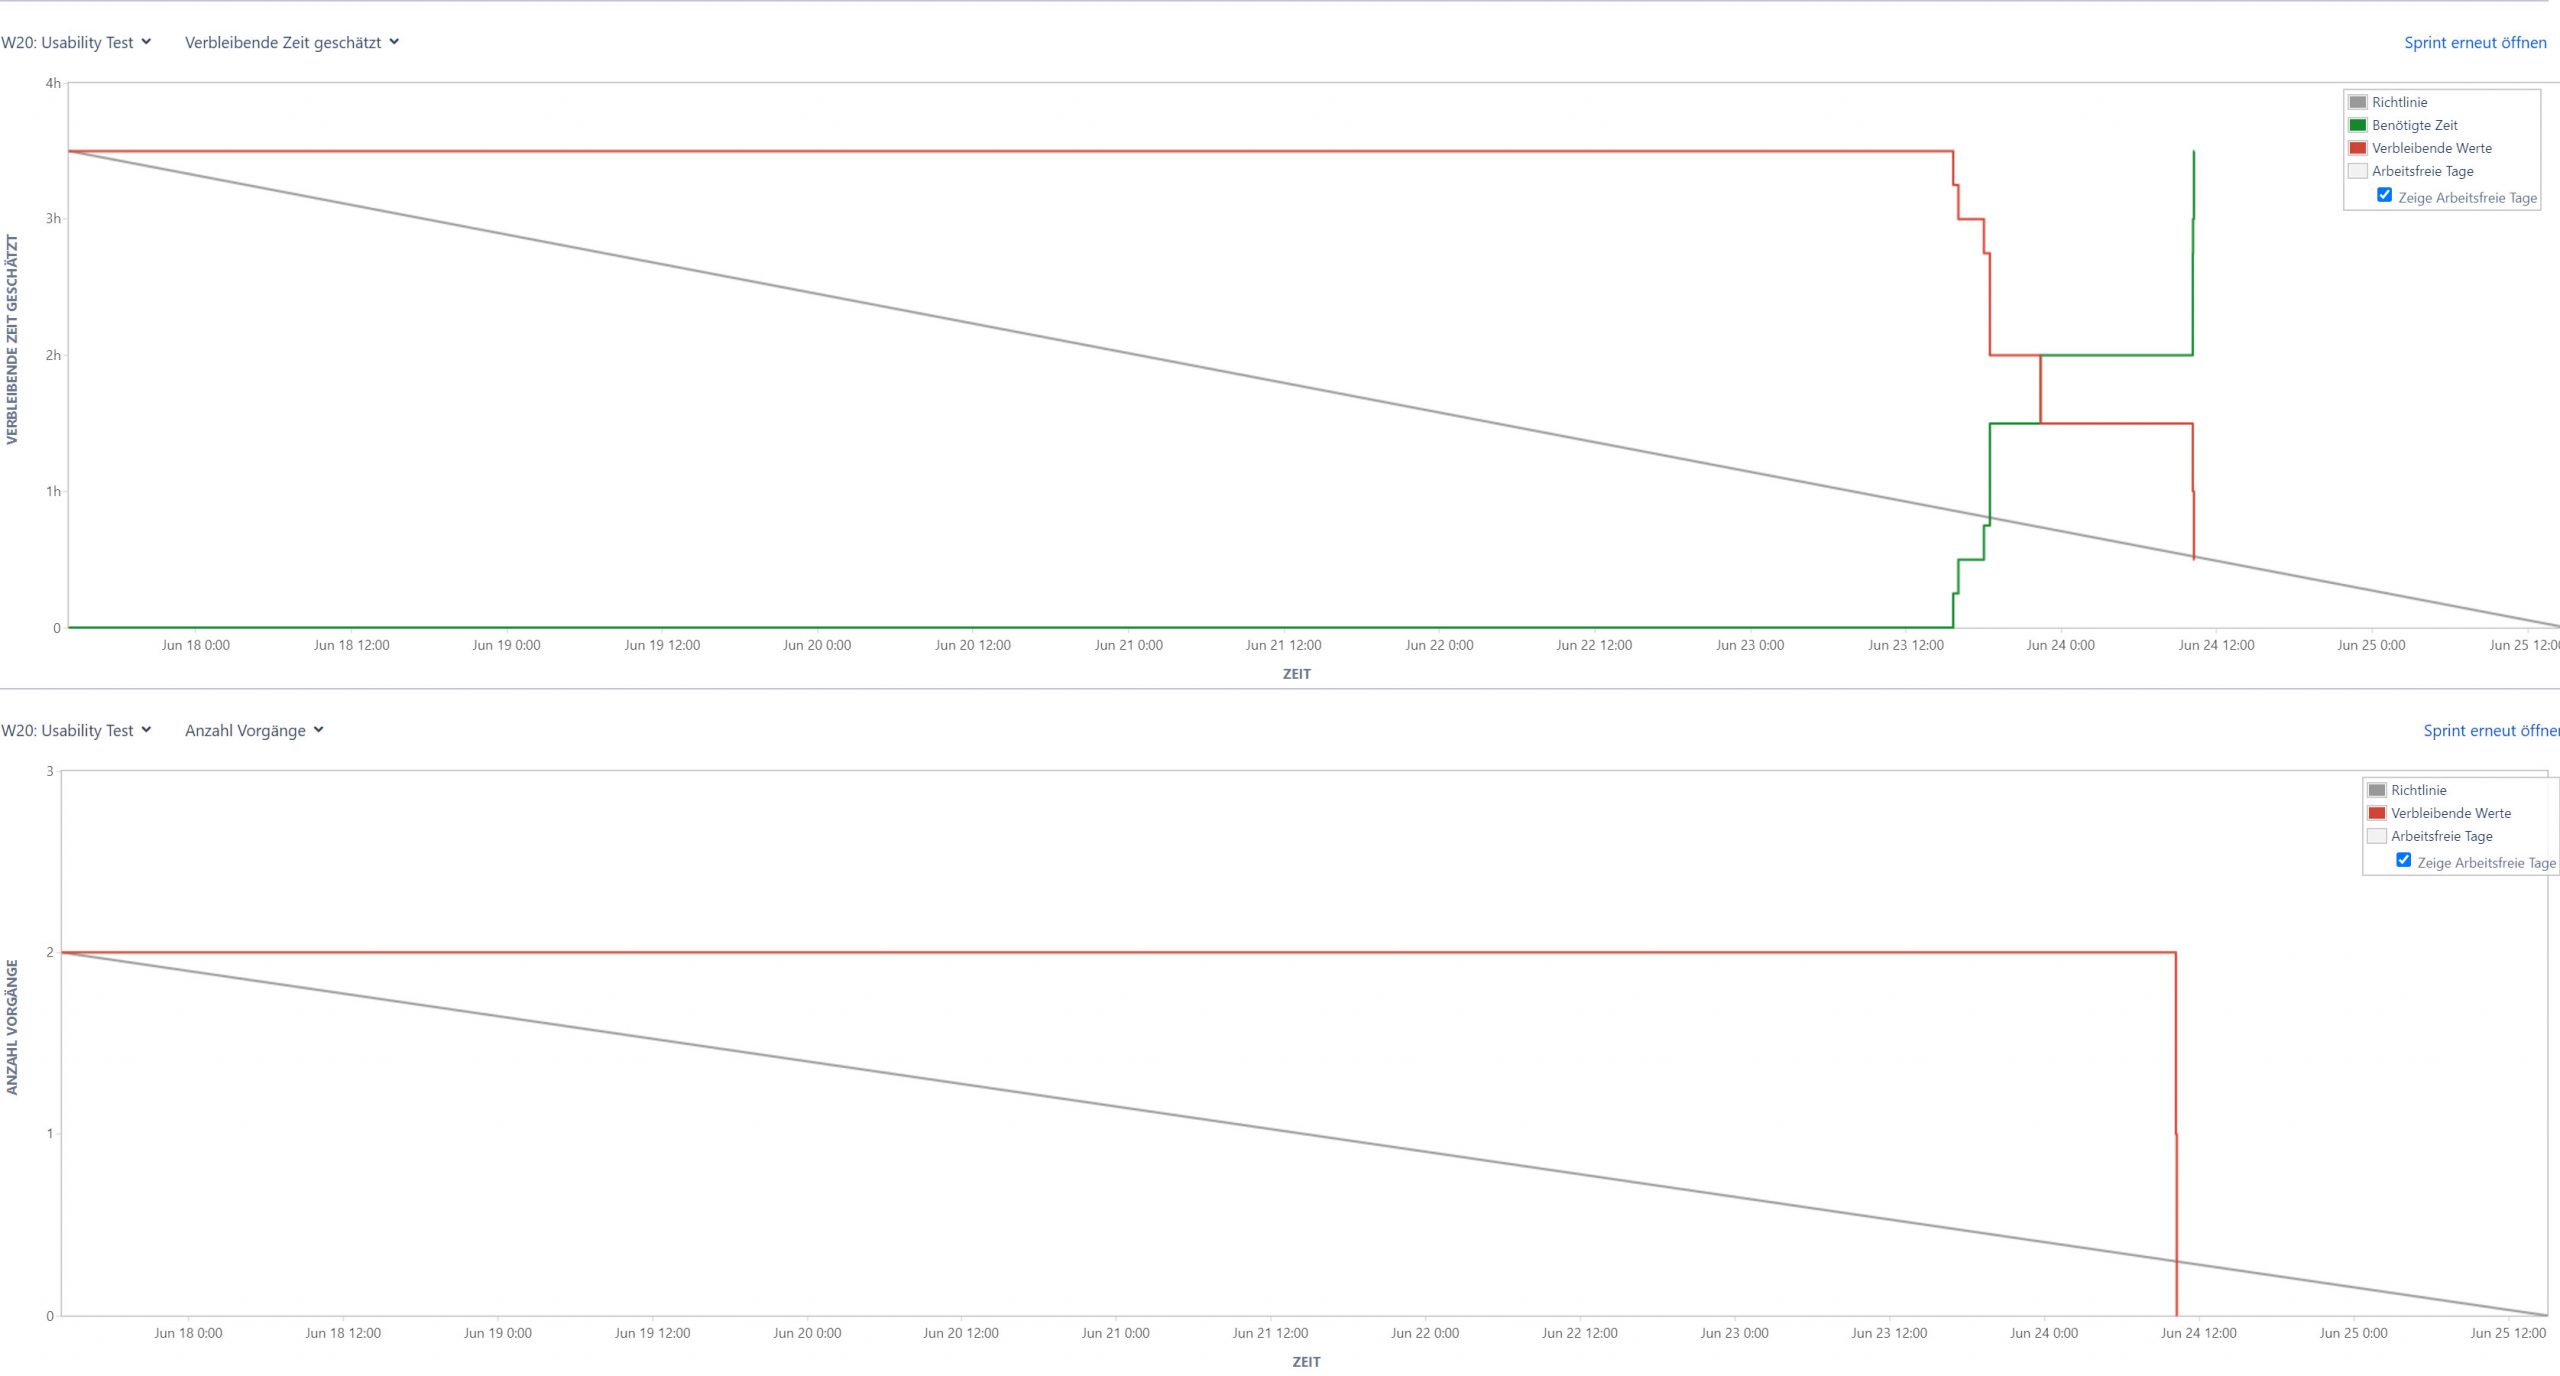
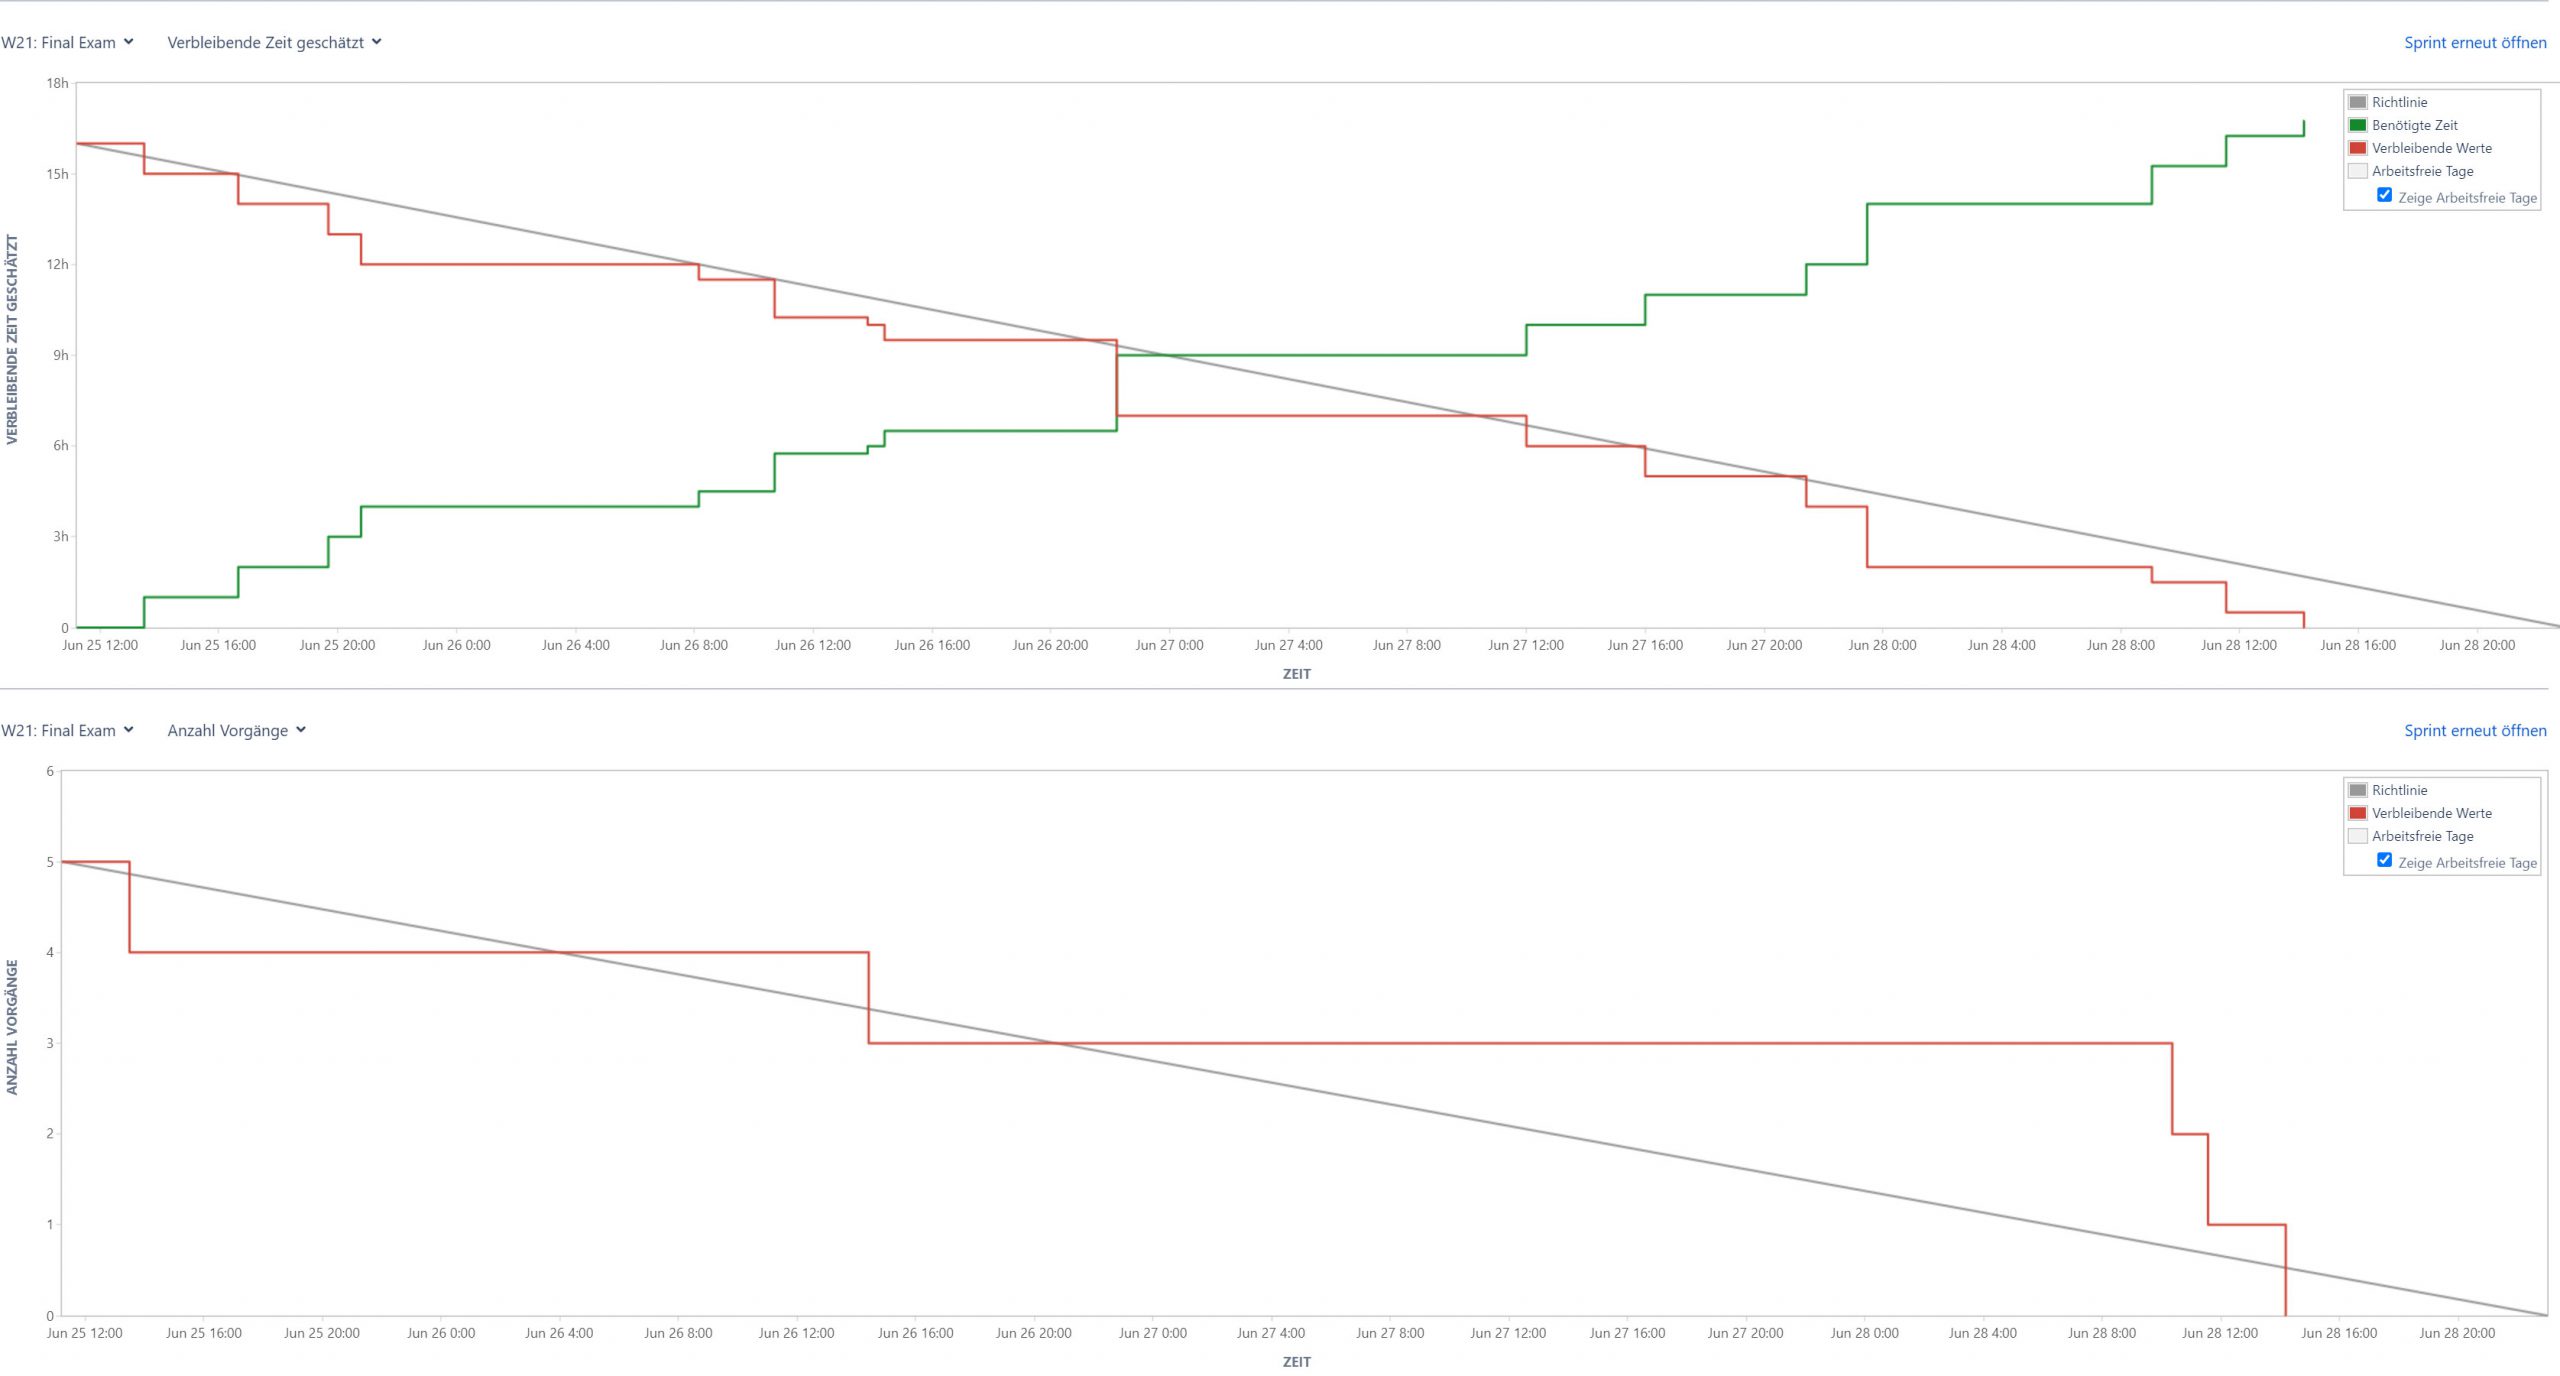
The whole "Tower Defense" project is developed making use of Scrum. Each week of the semester is demonstrated by one single sprint. For the first week, there is not any sprint existing because the project was not set up yet.
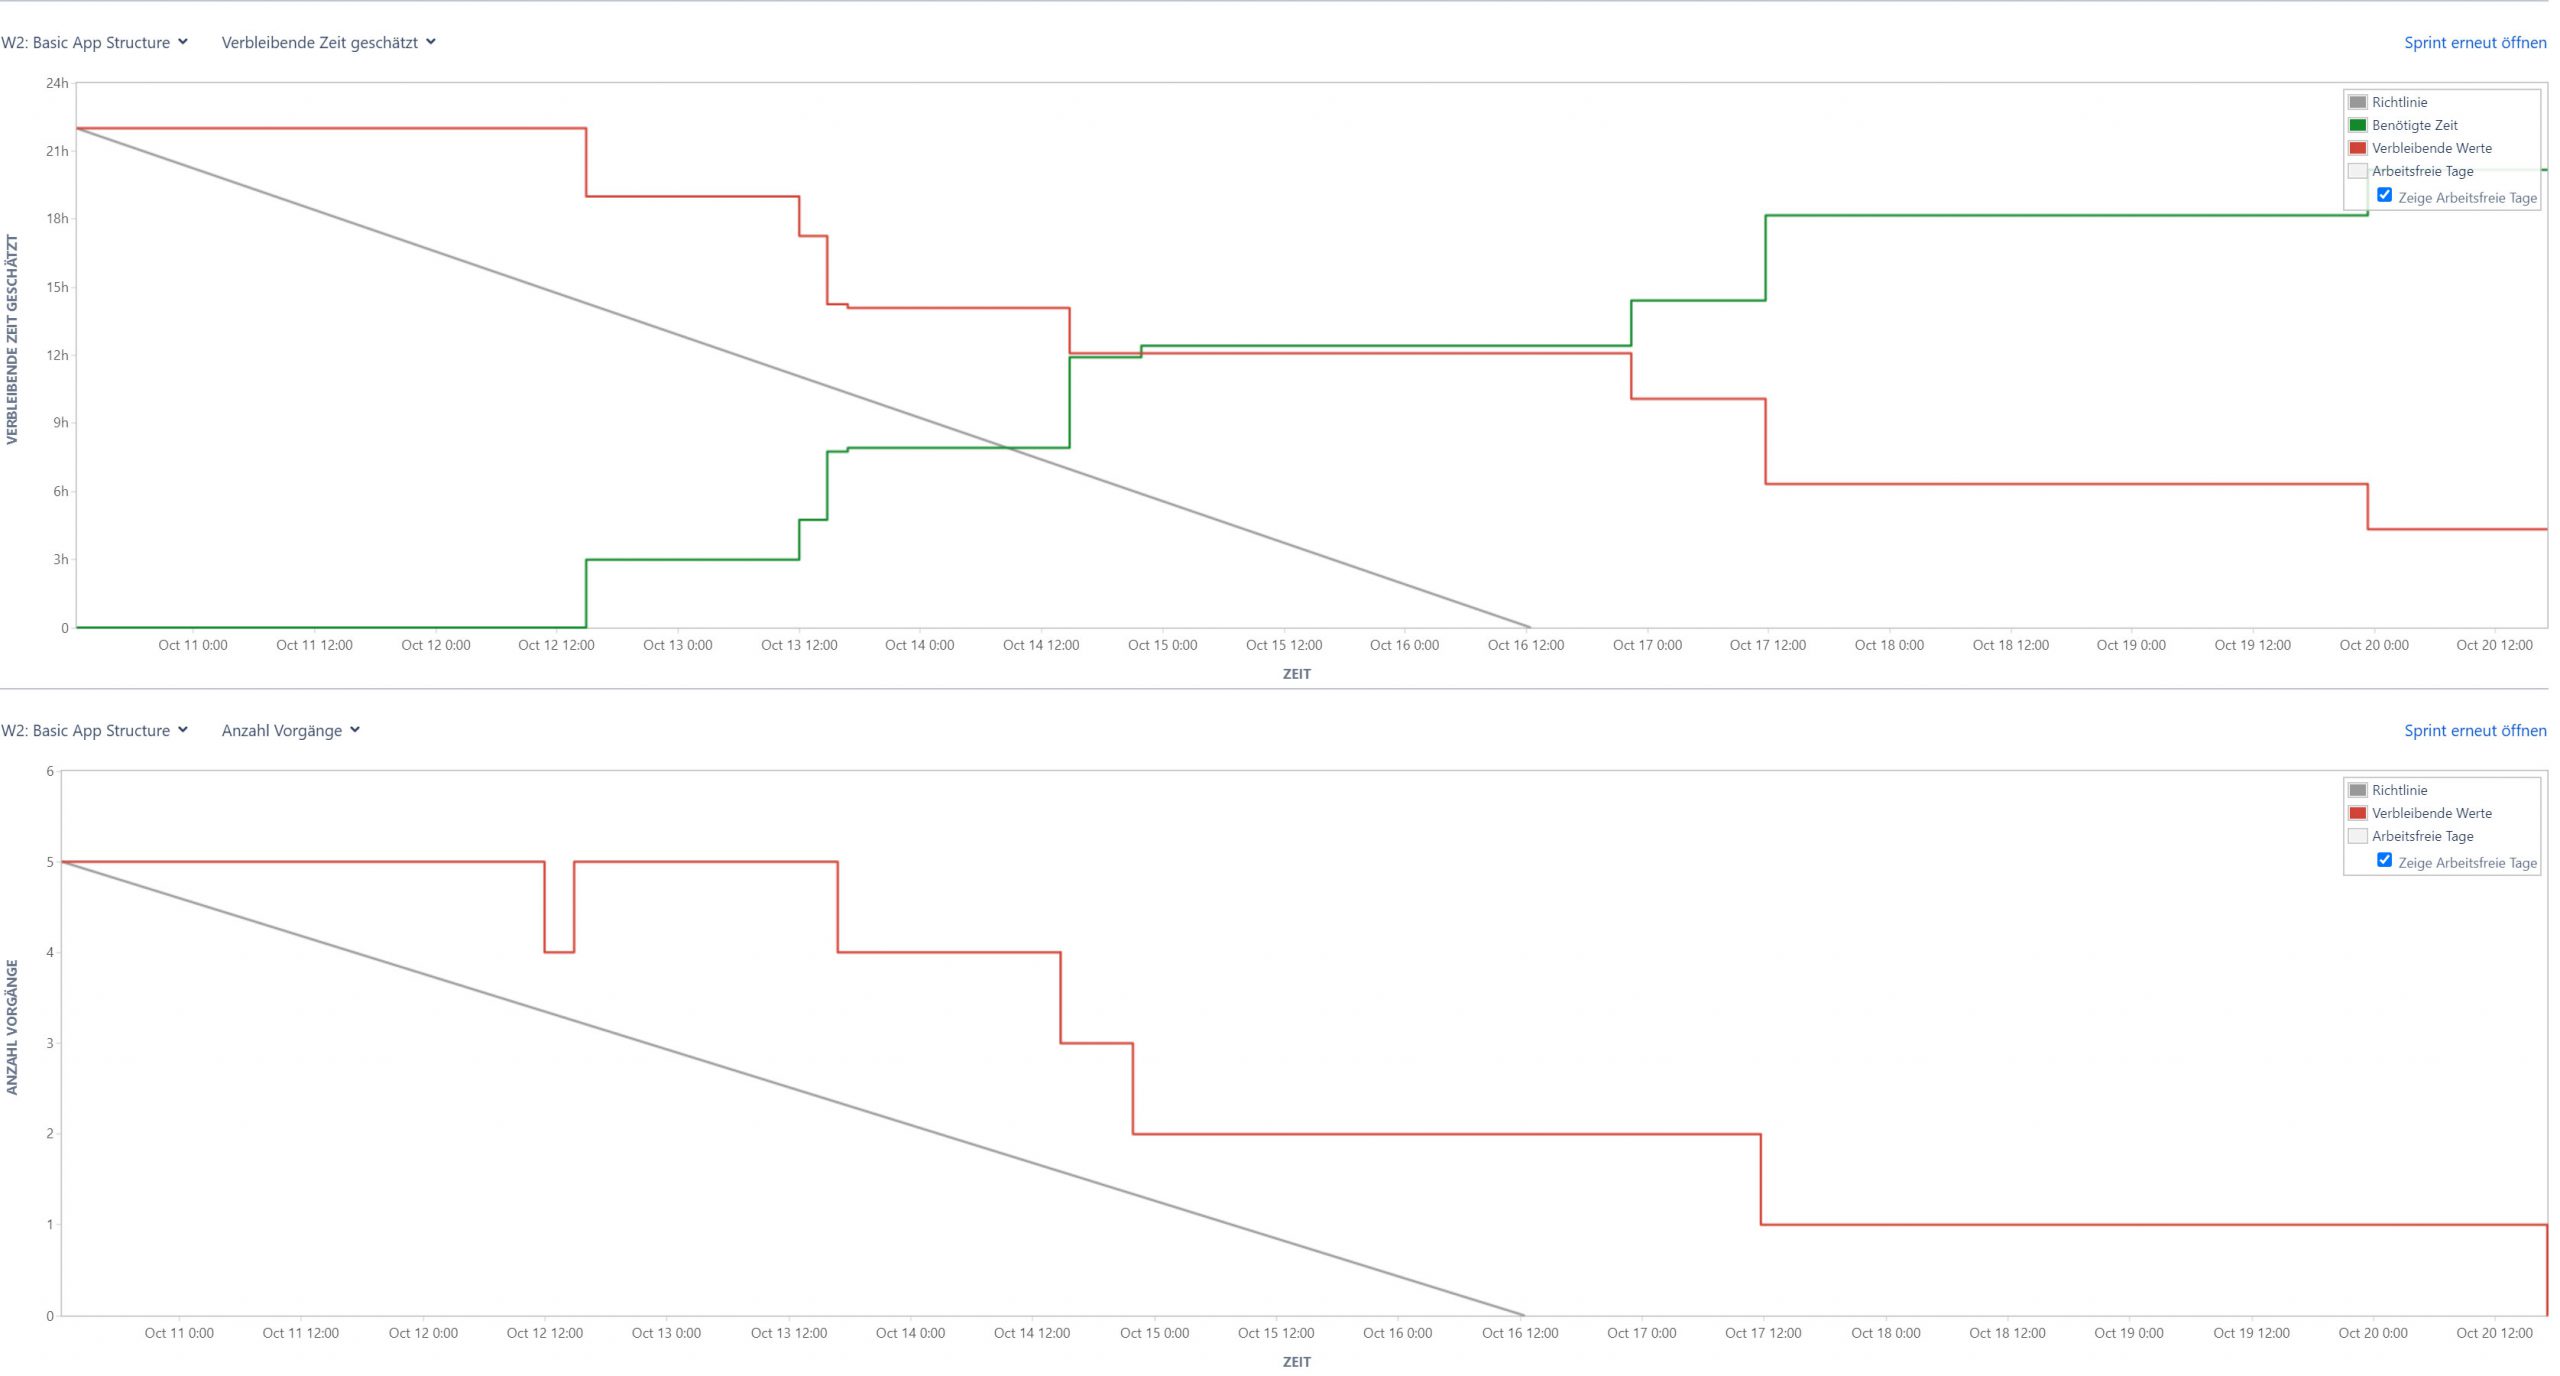
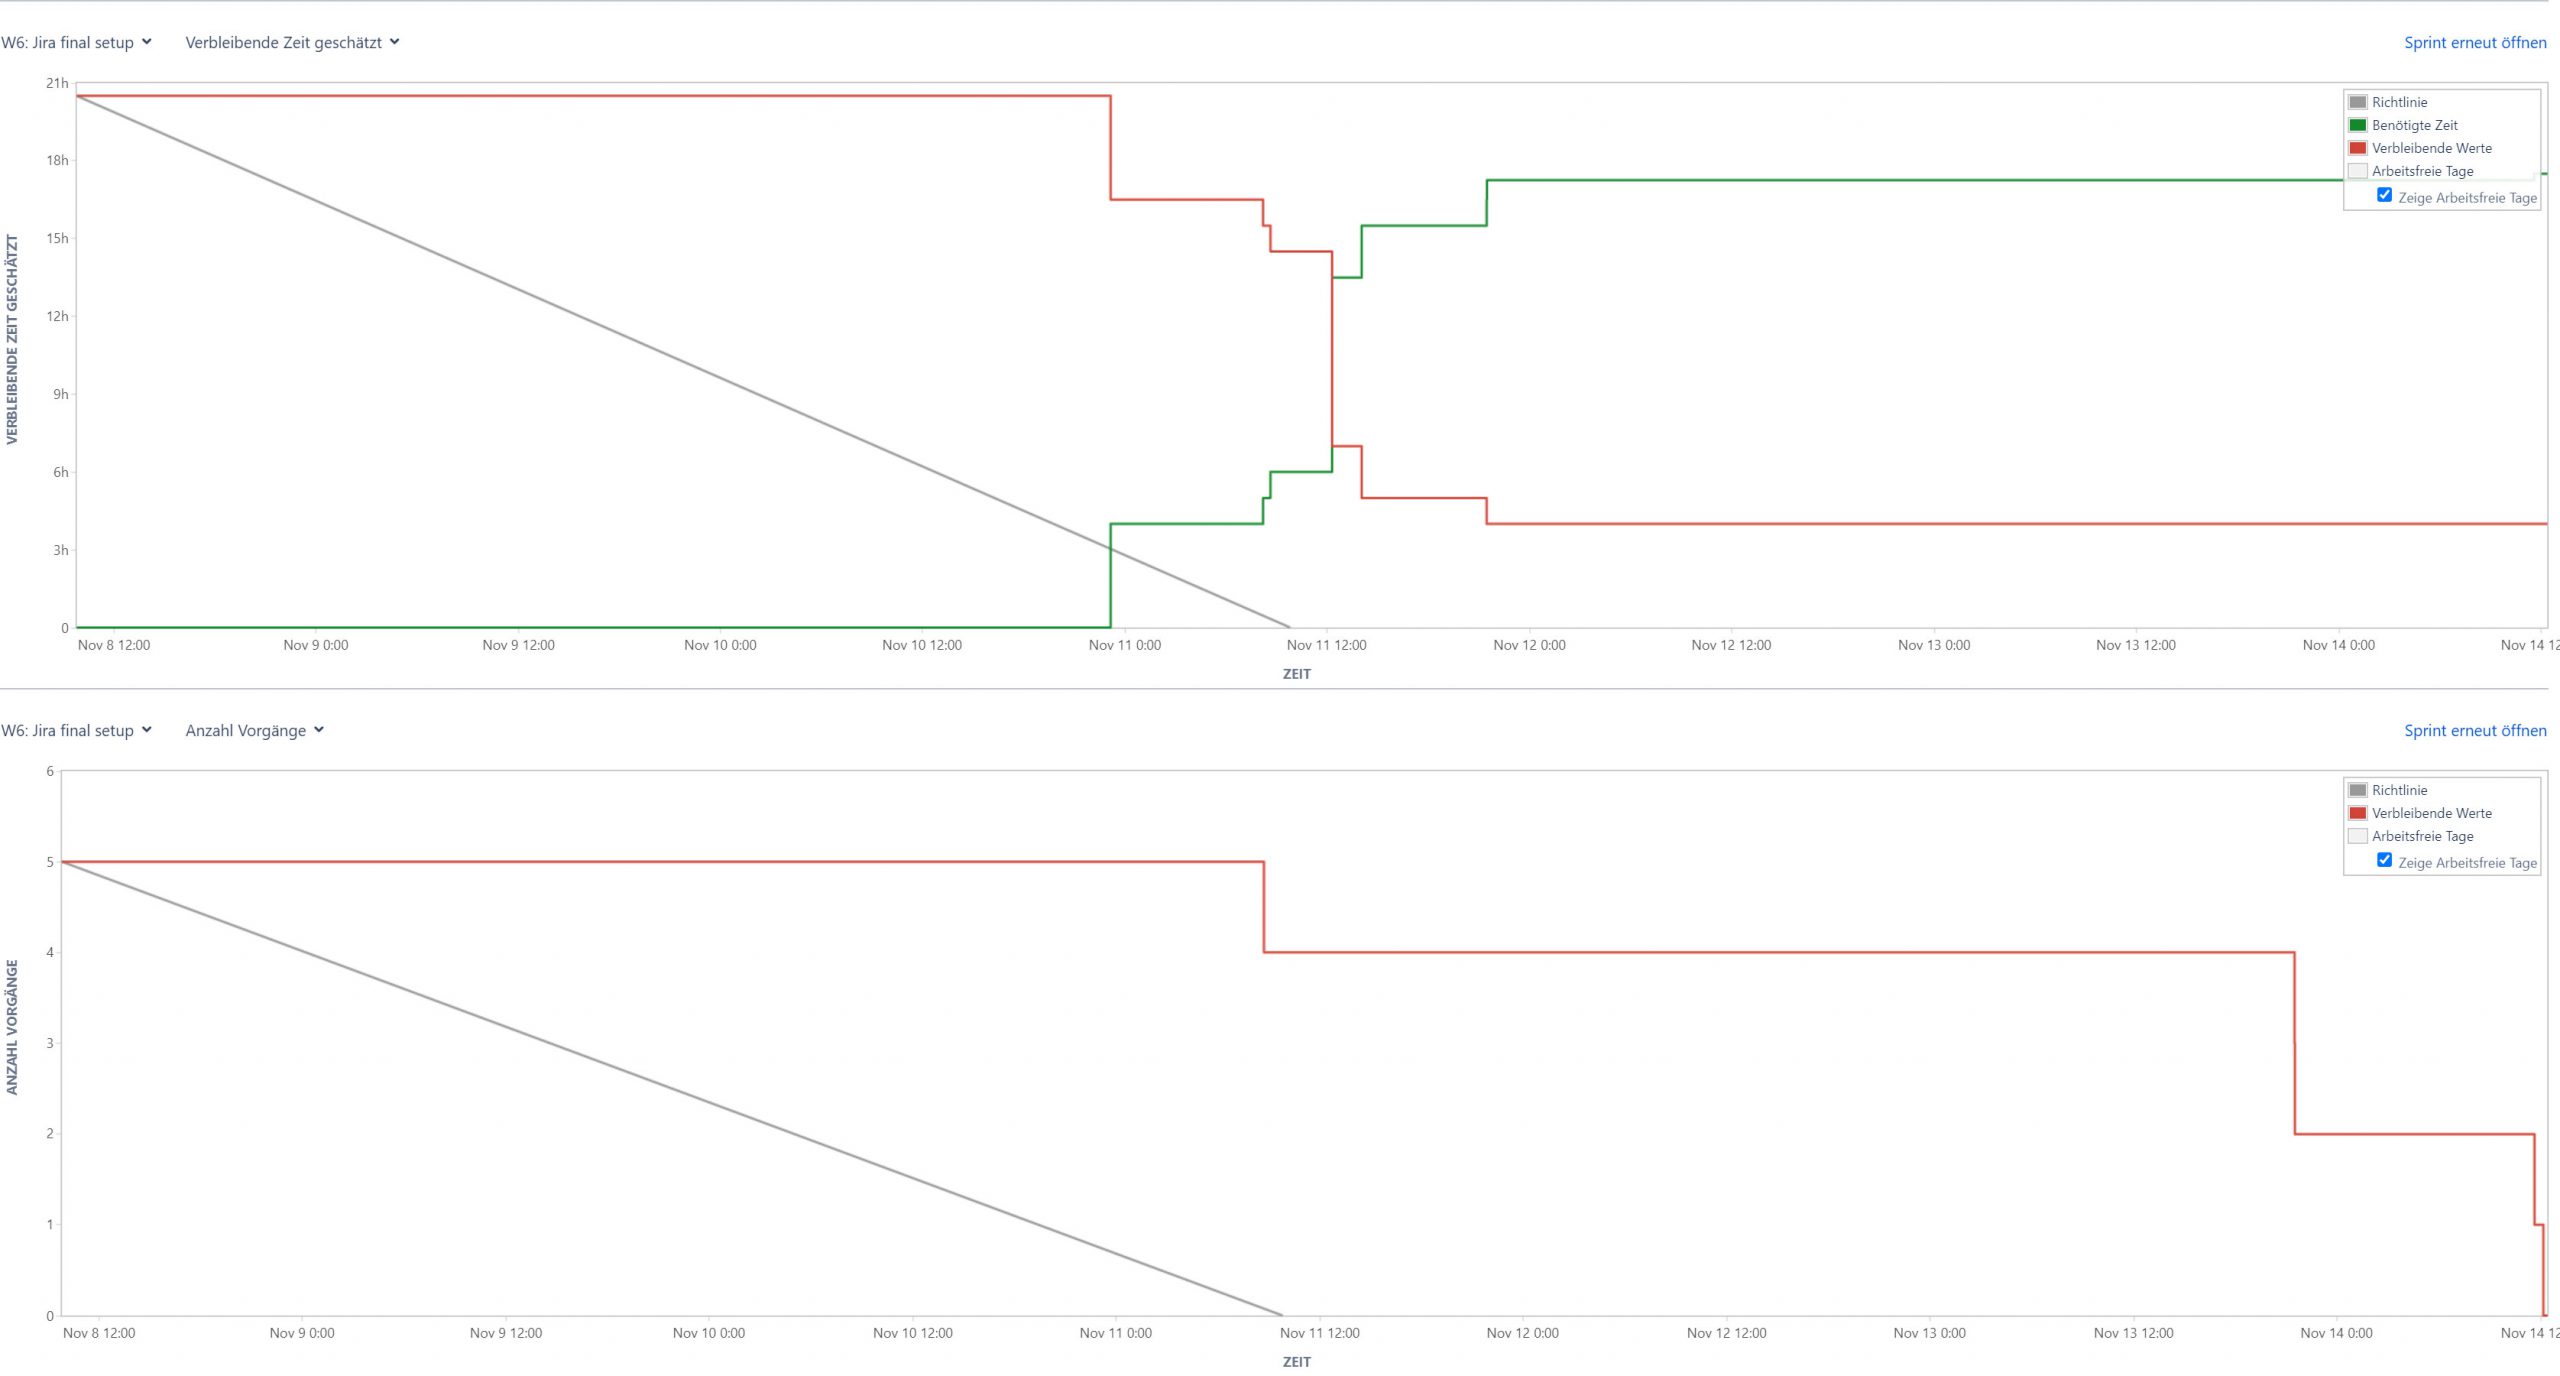
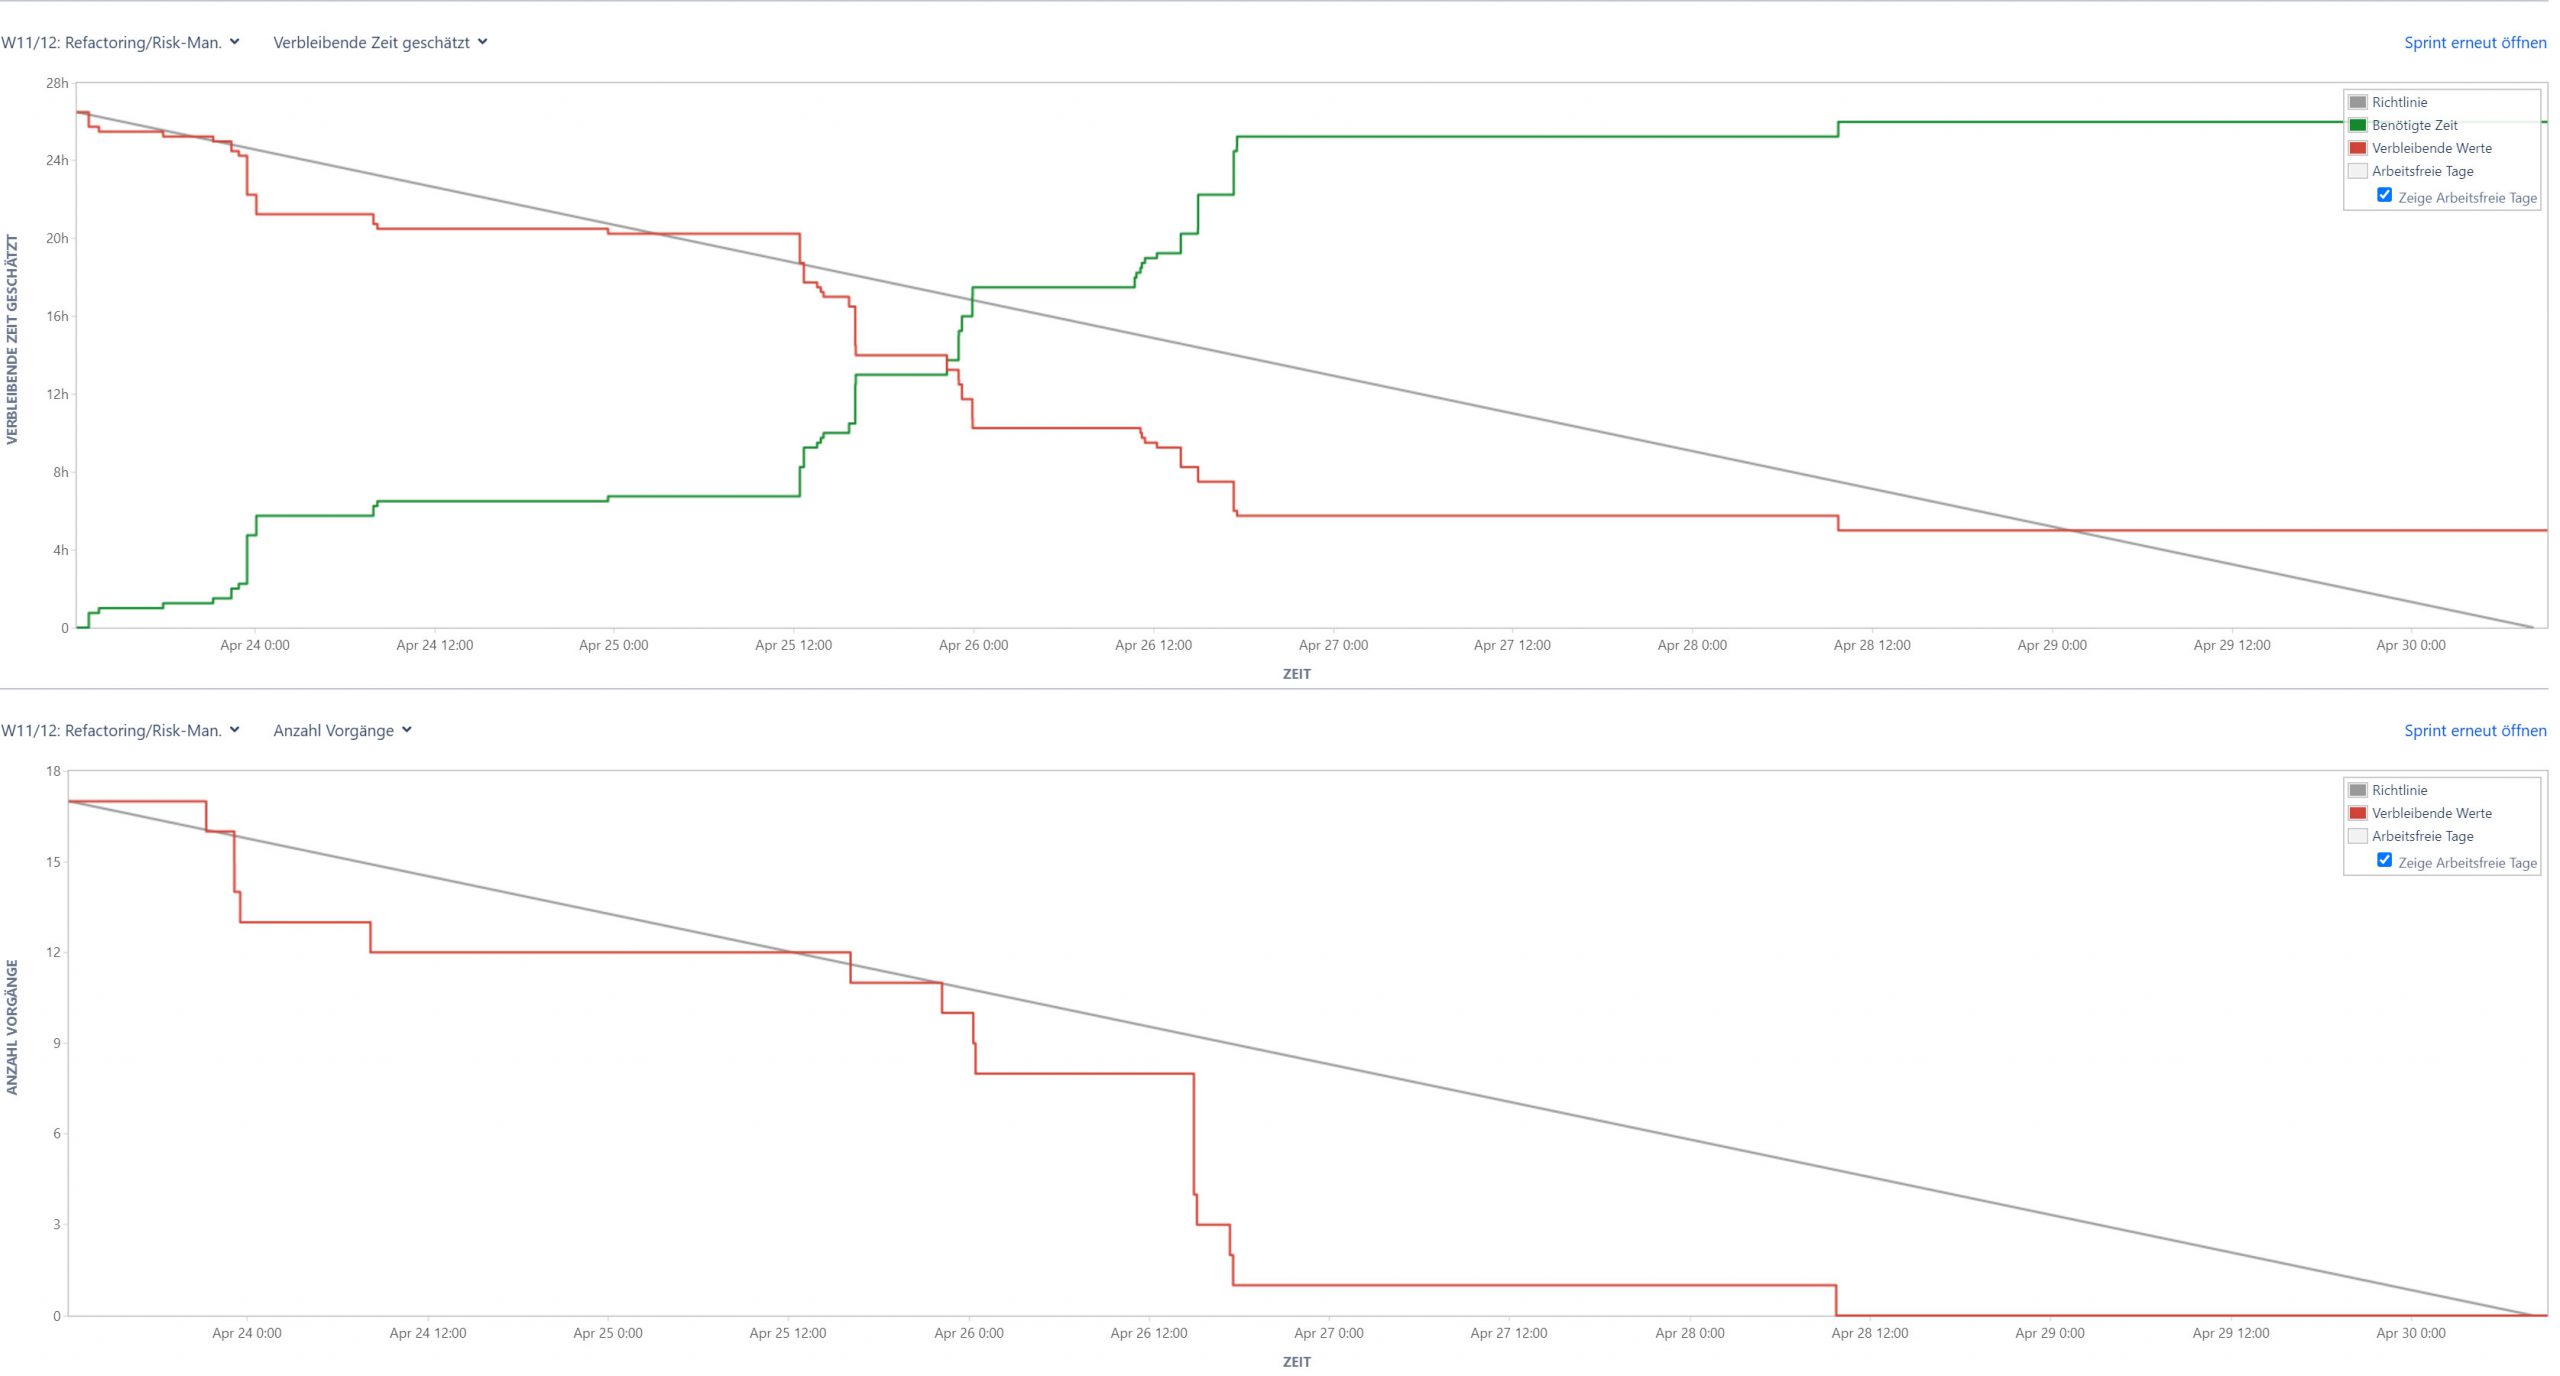
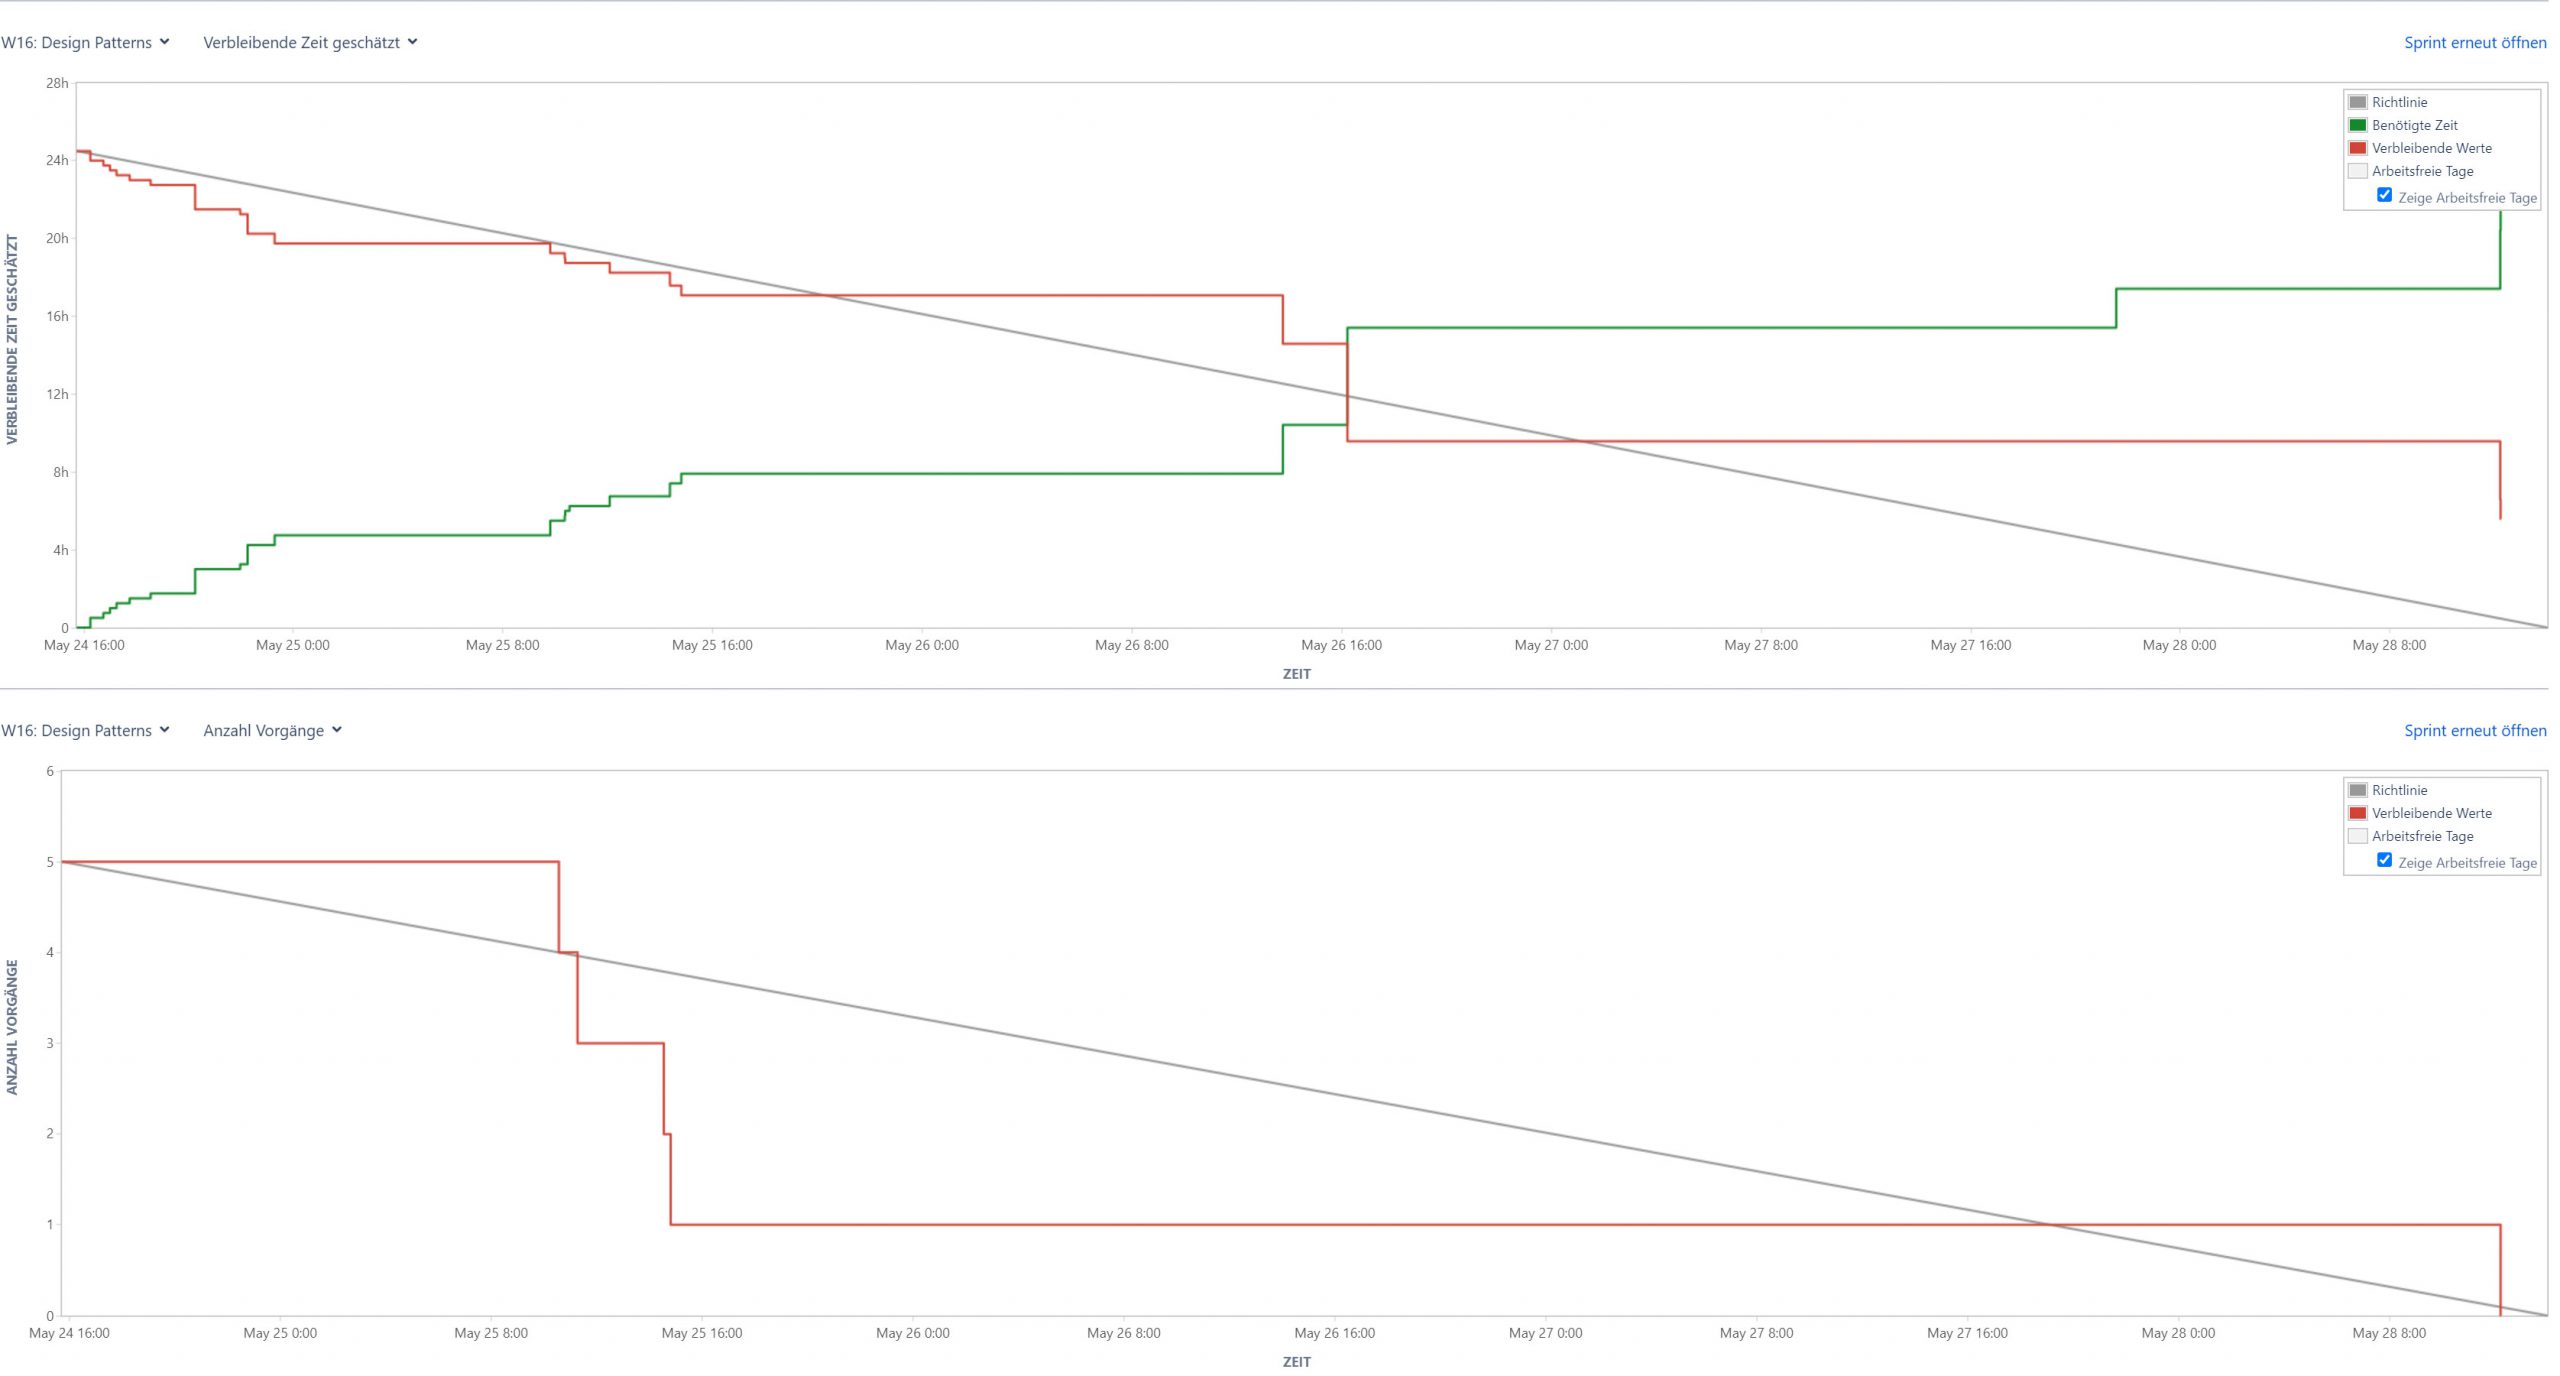
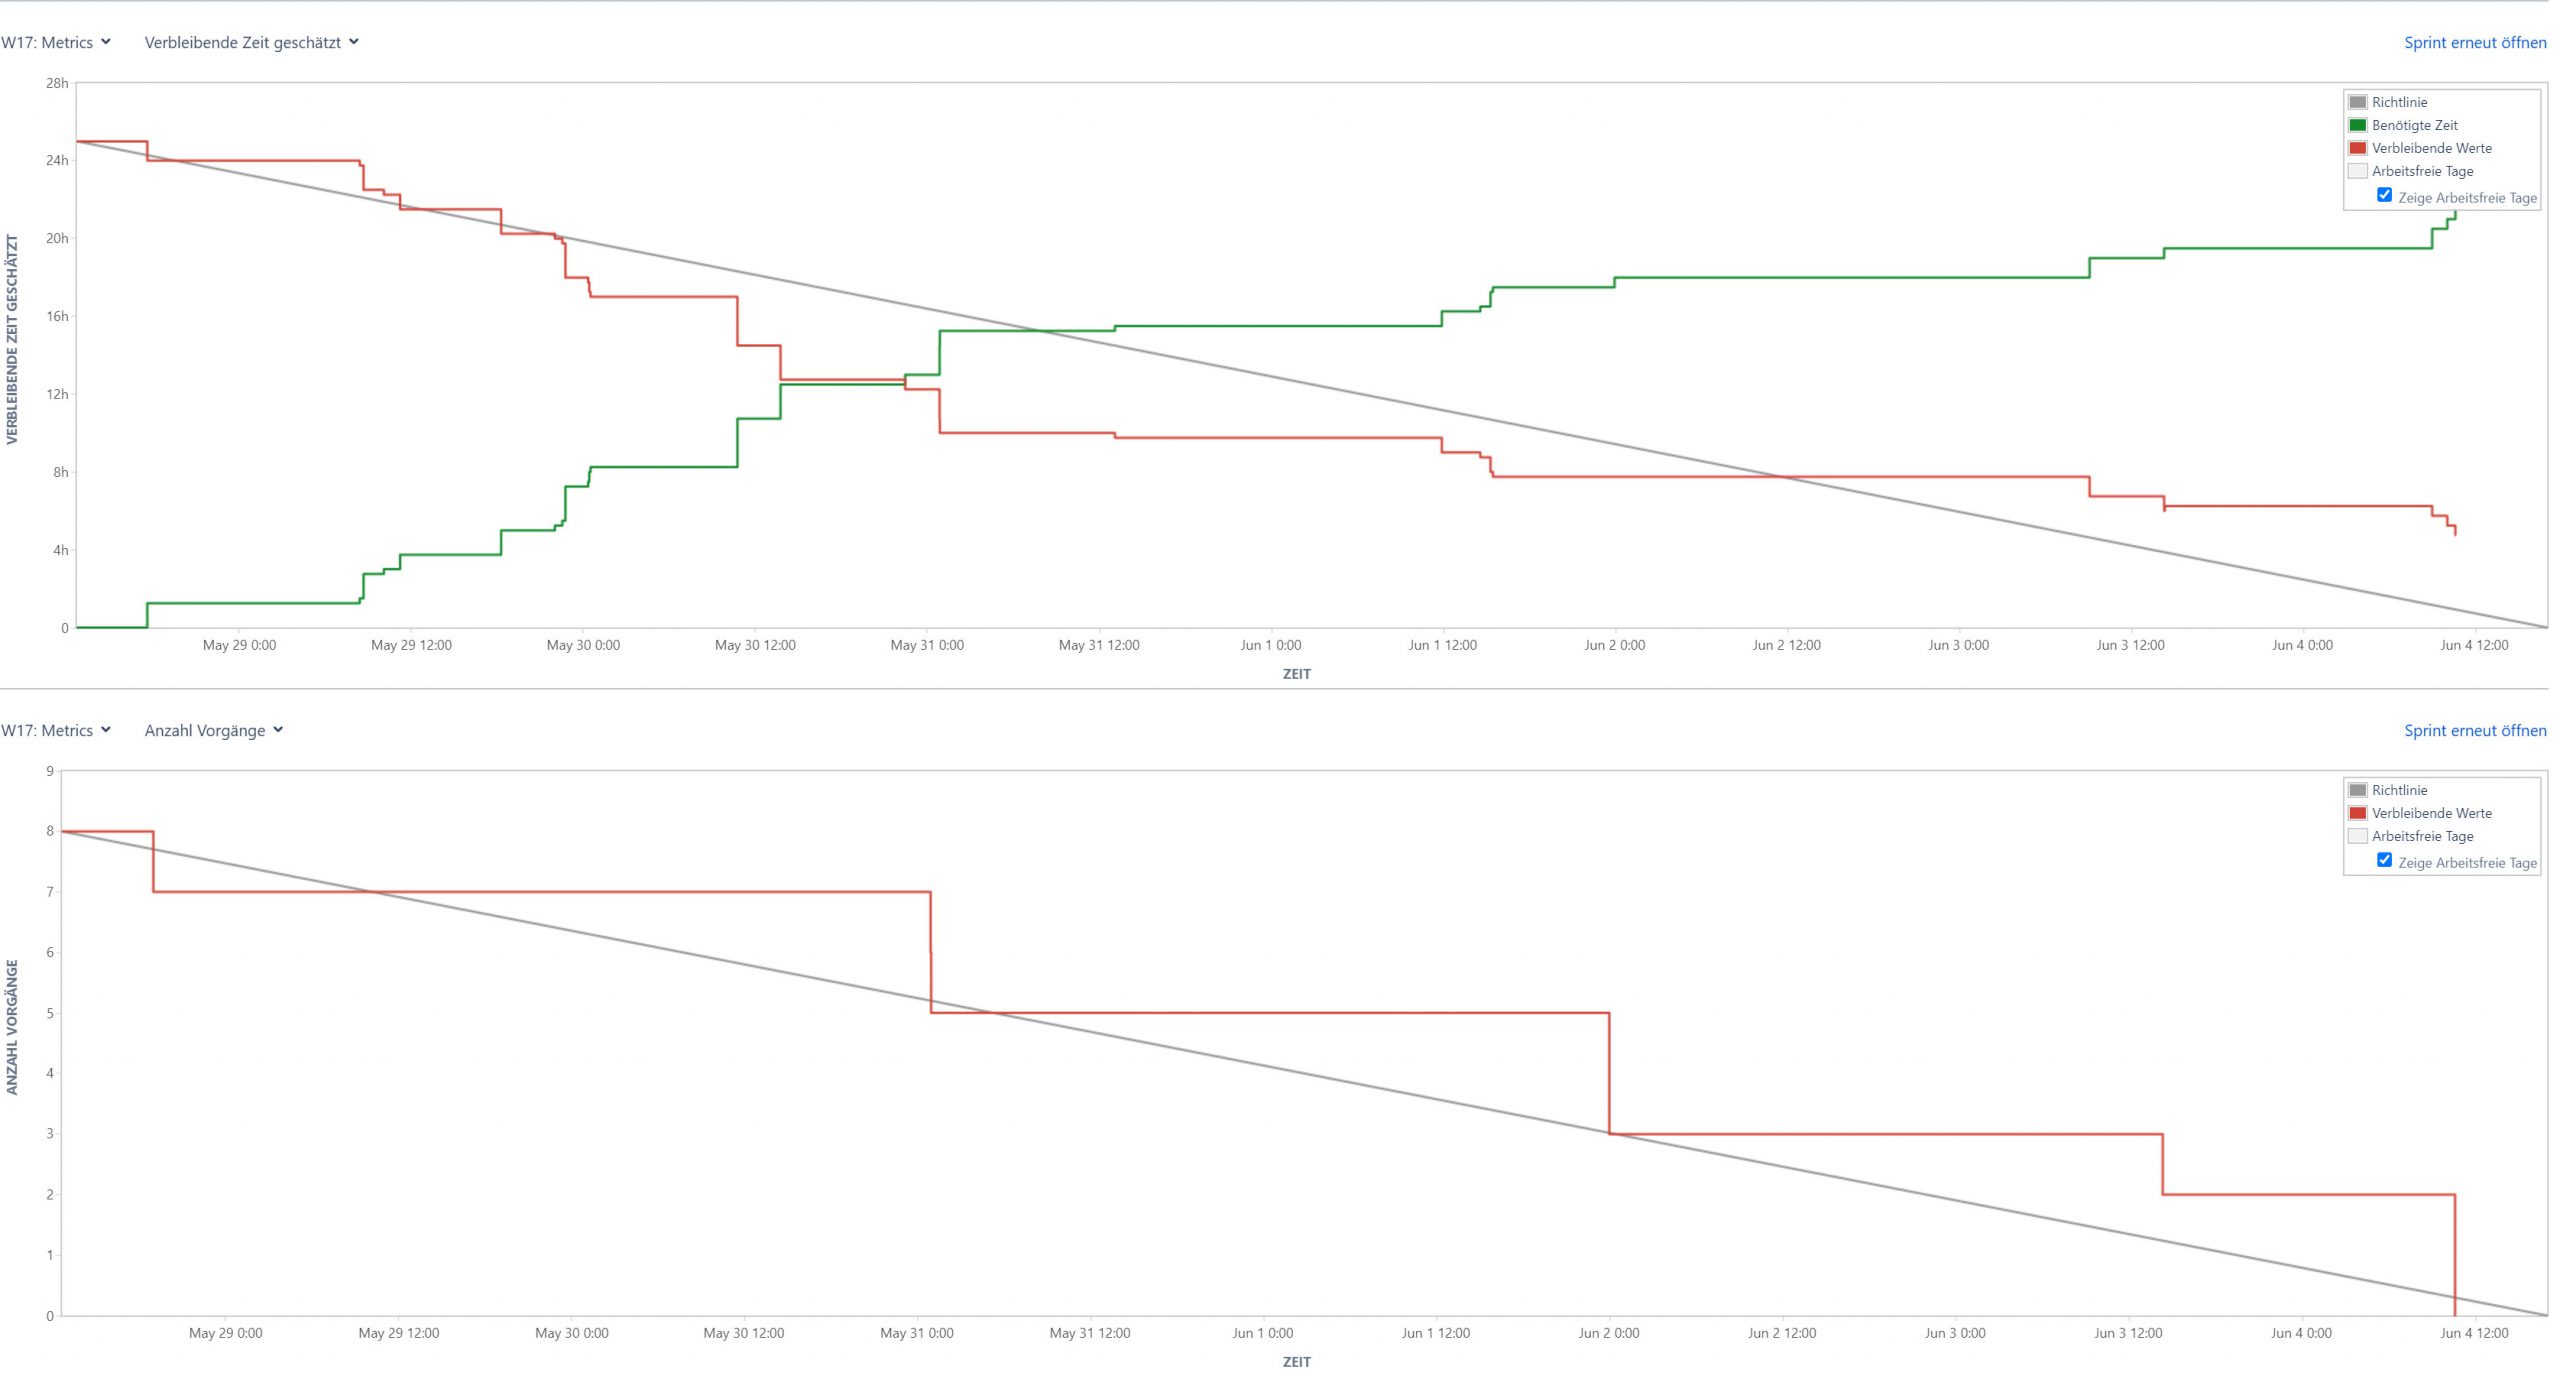
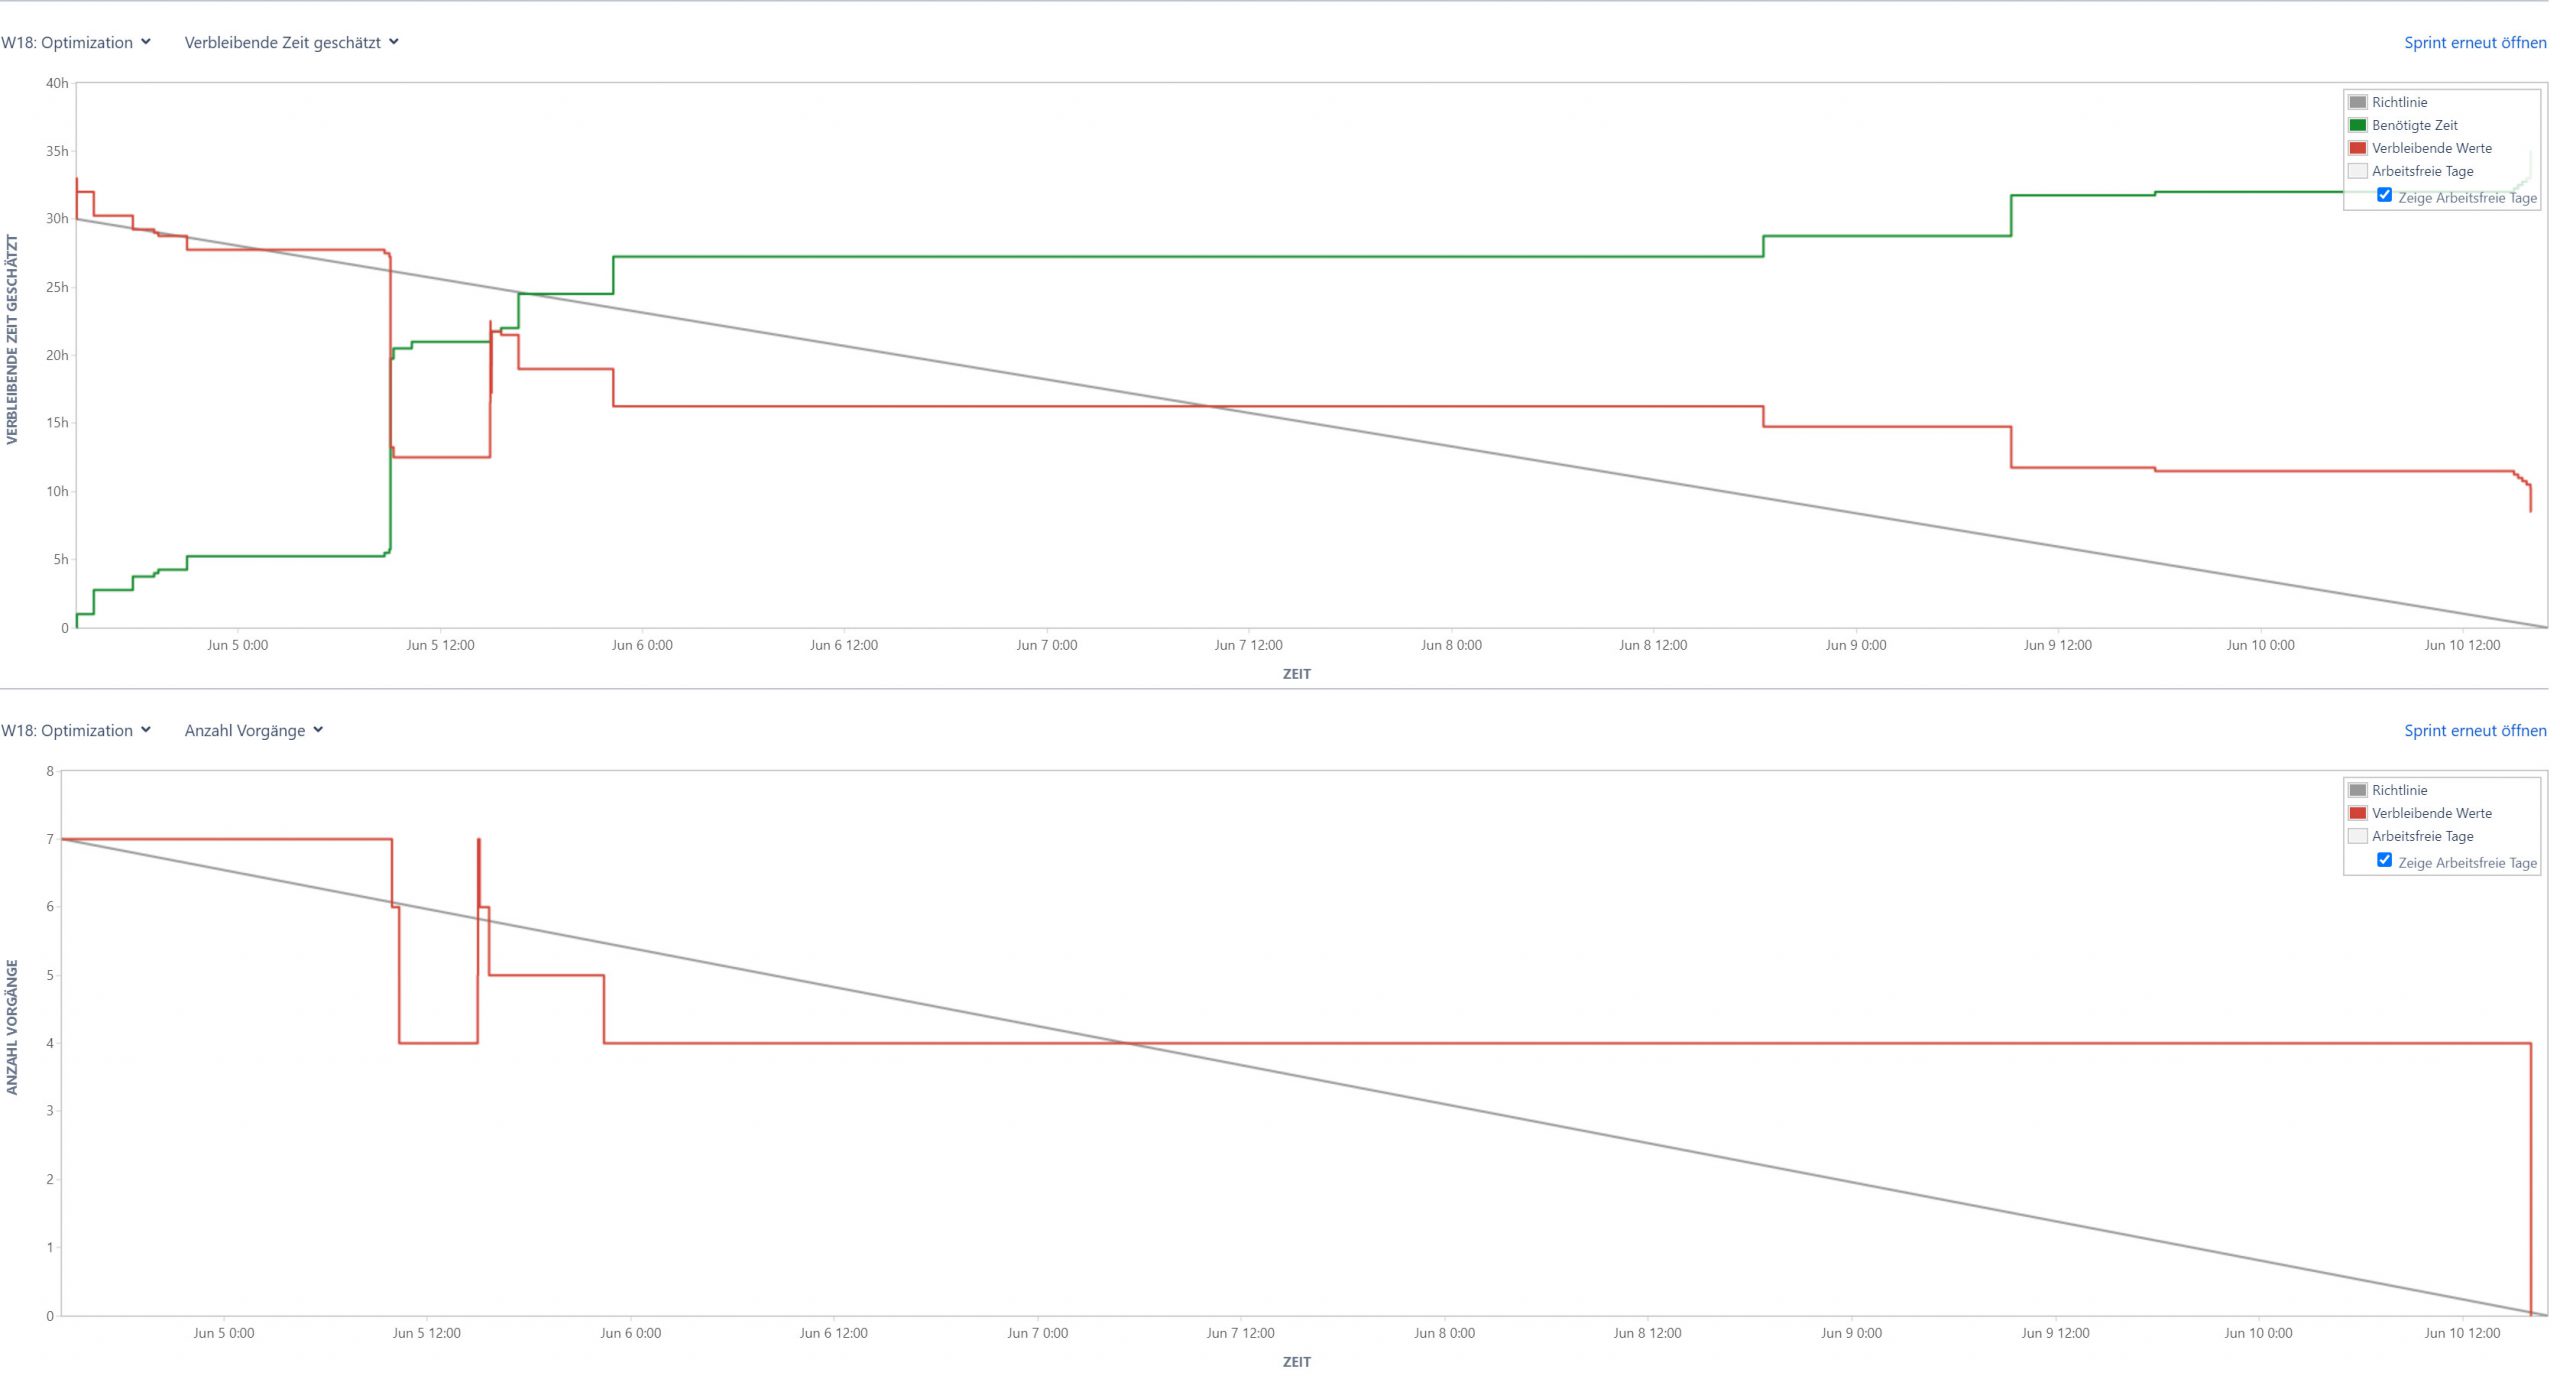
Within the next weeks, our team had to get along with Jira at first which is why our first burndown-diagrams are not pretty nice.
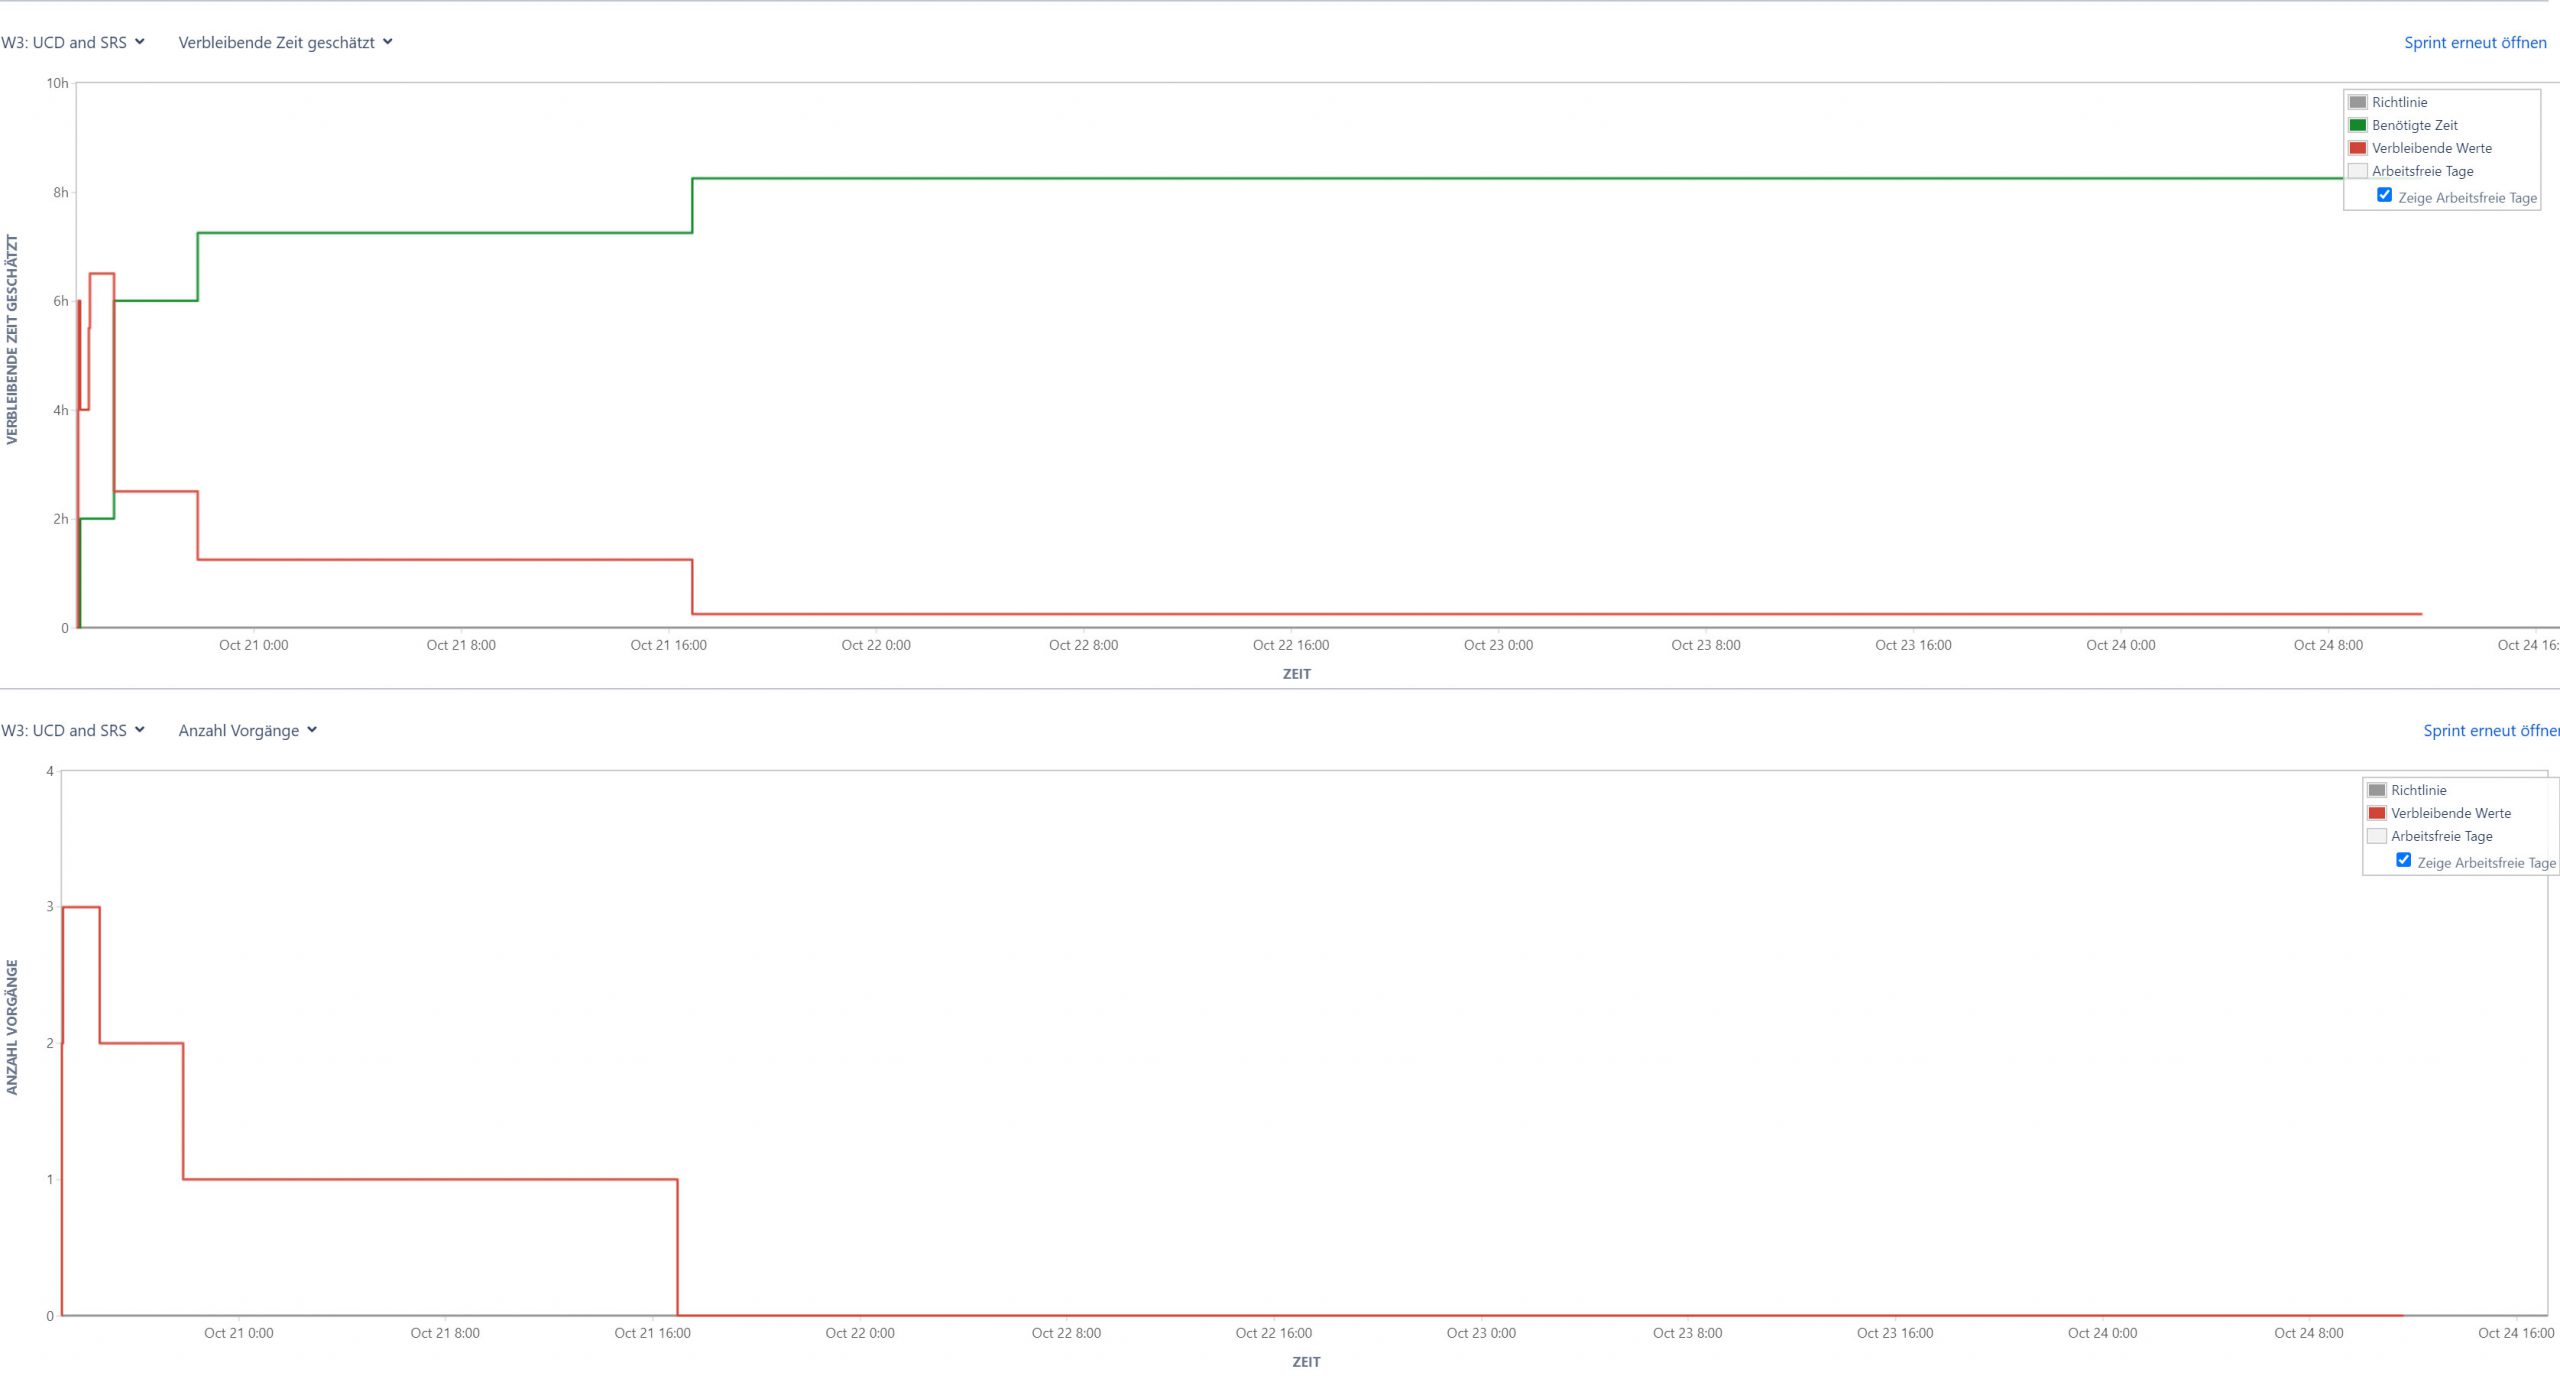
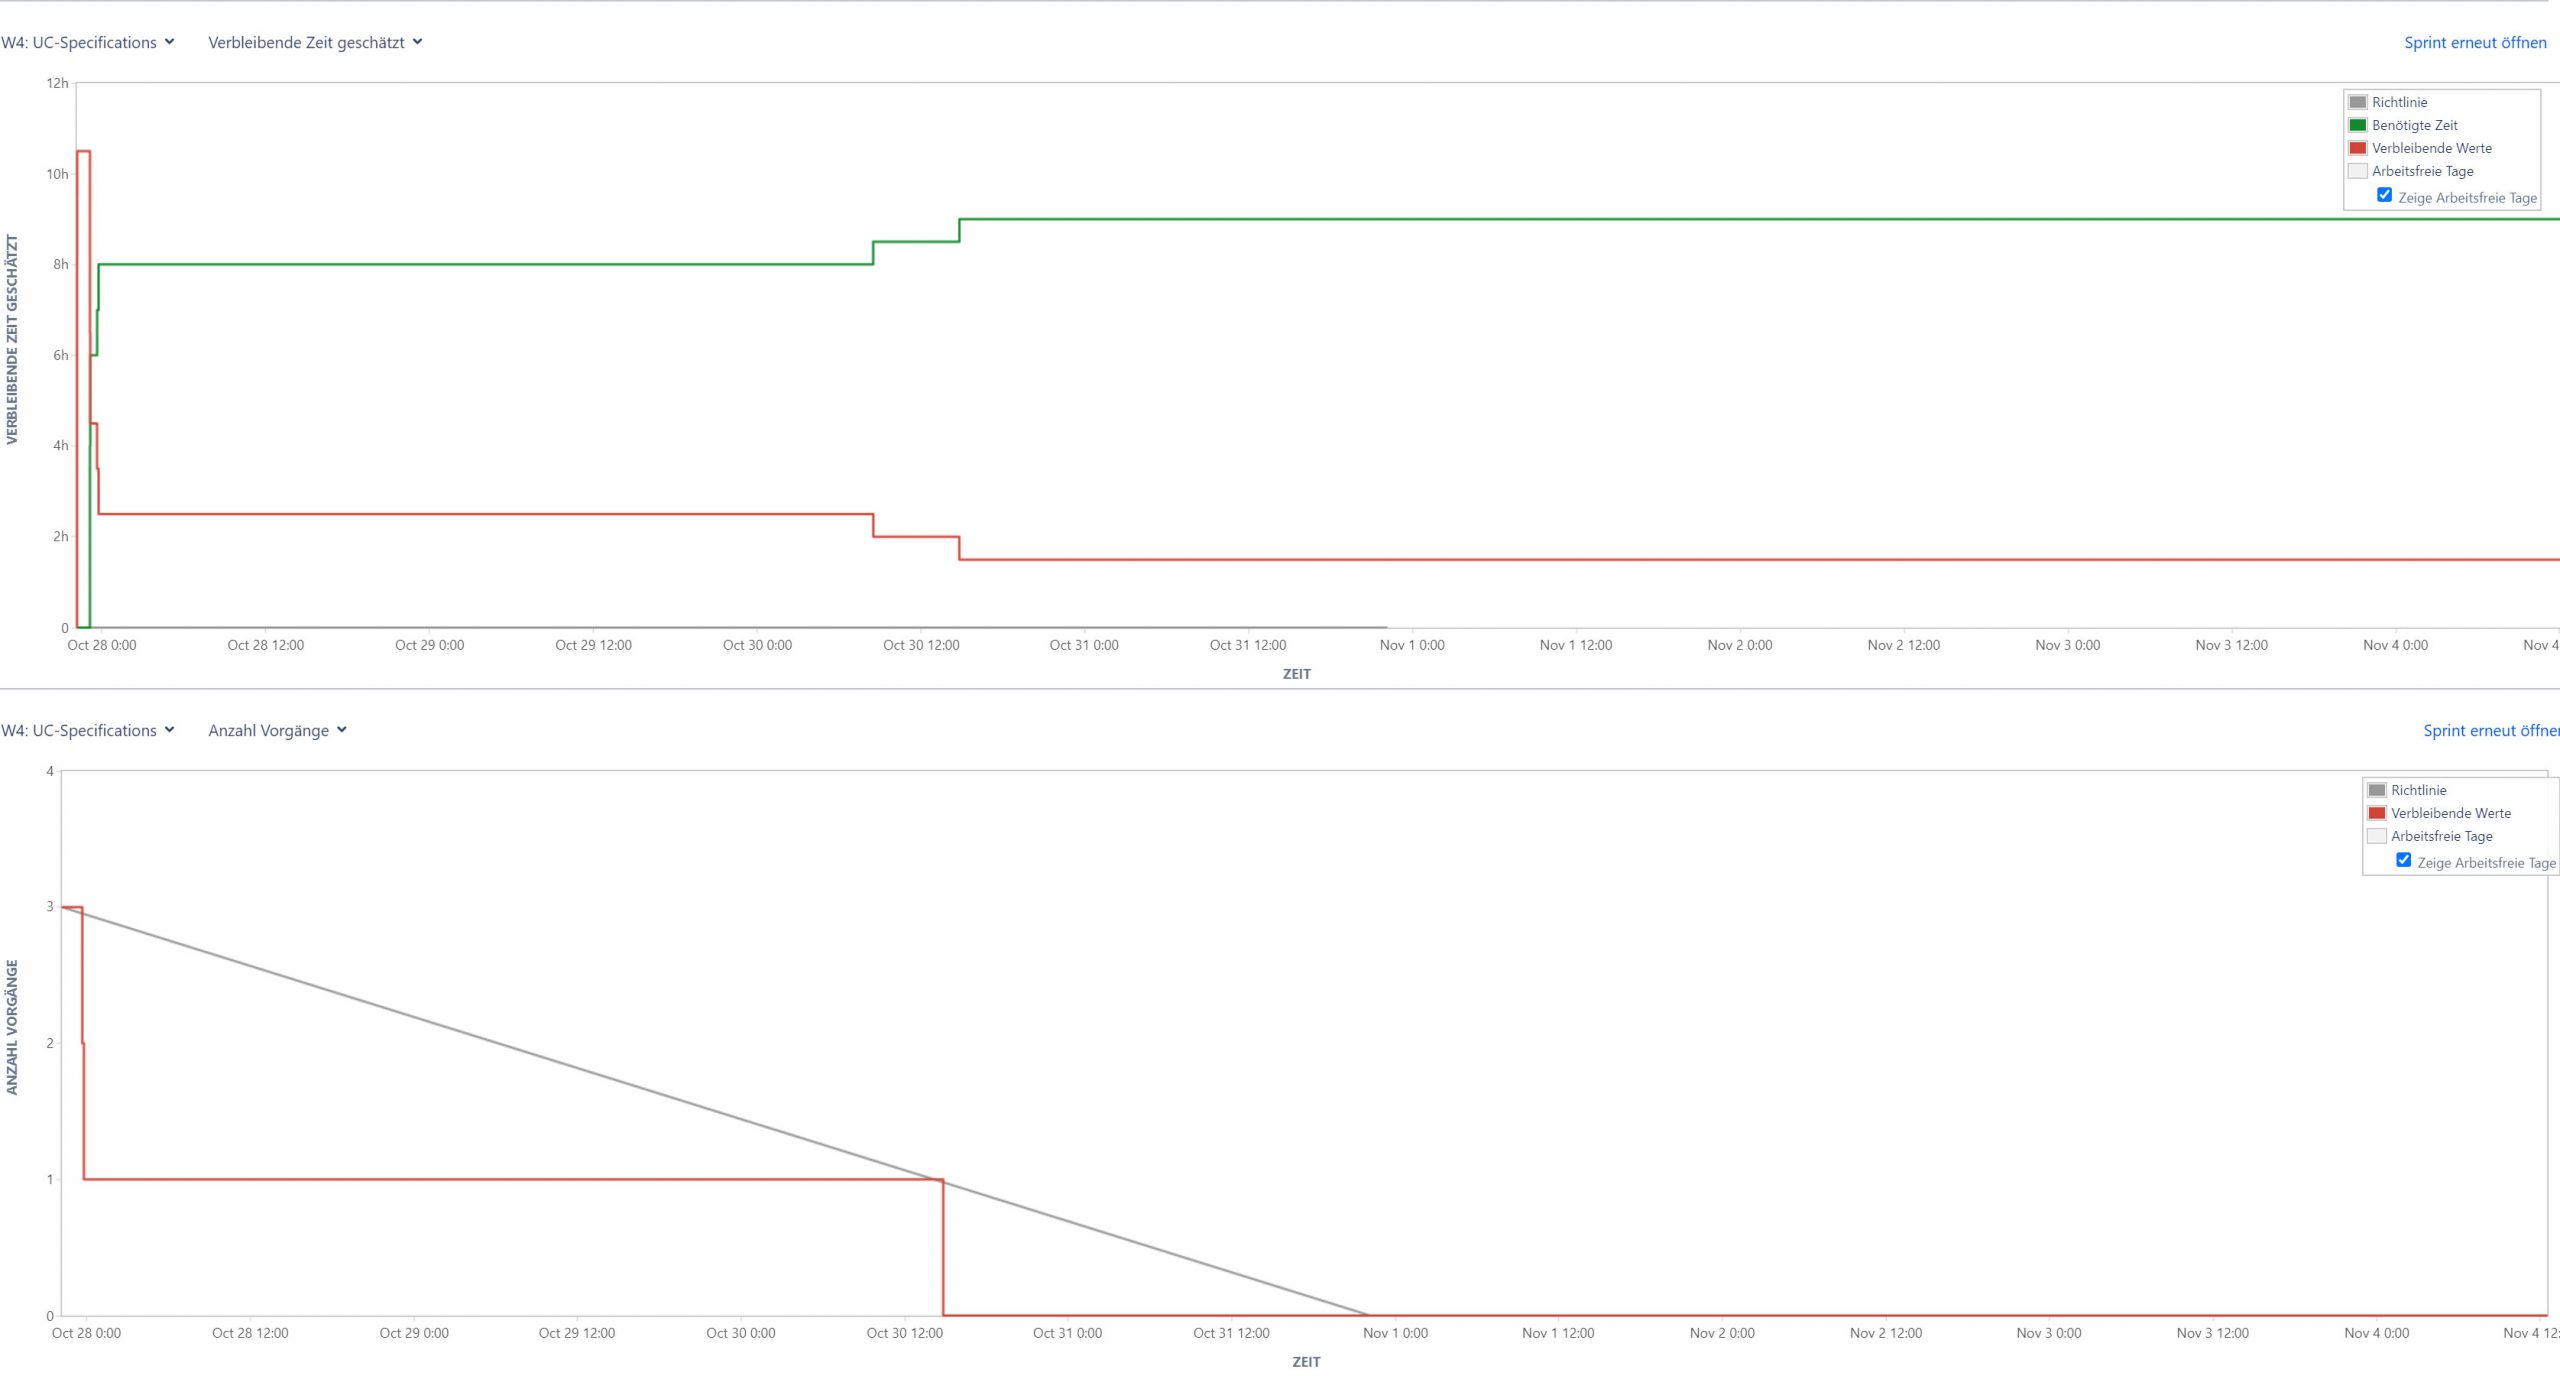
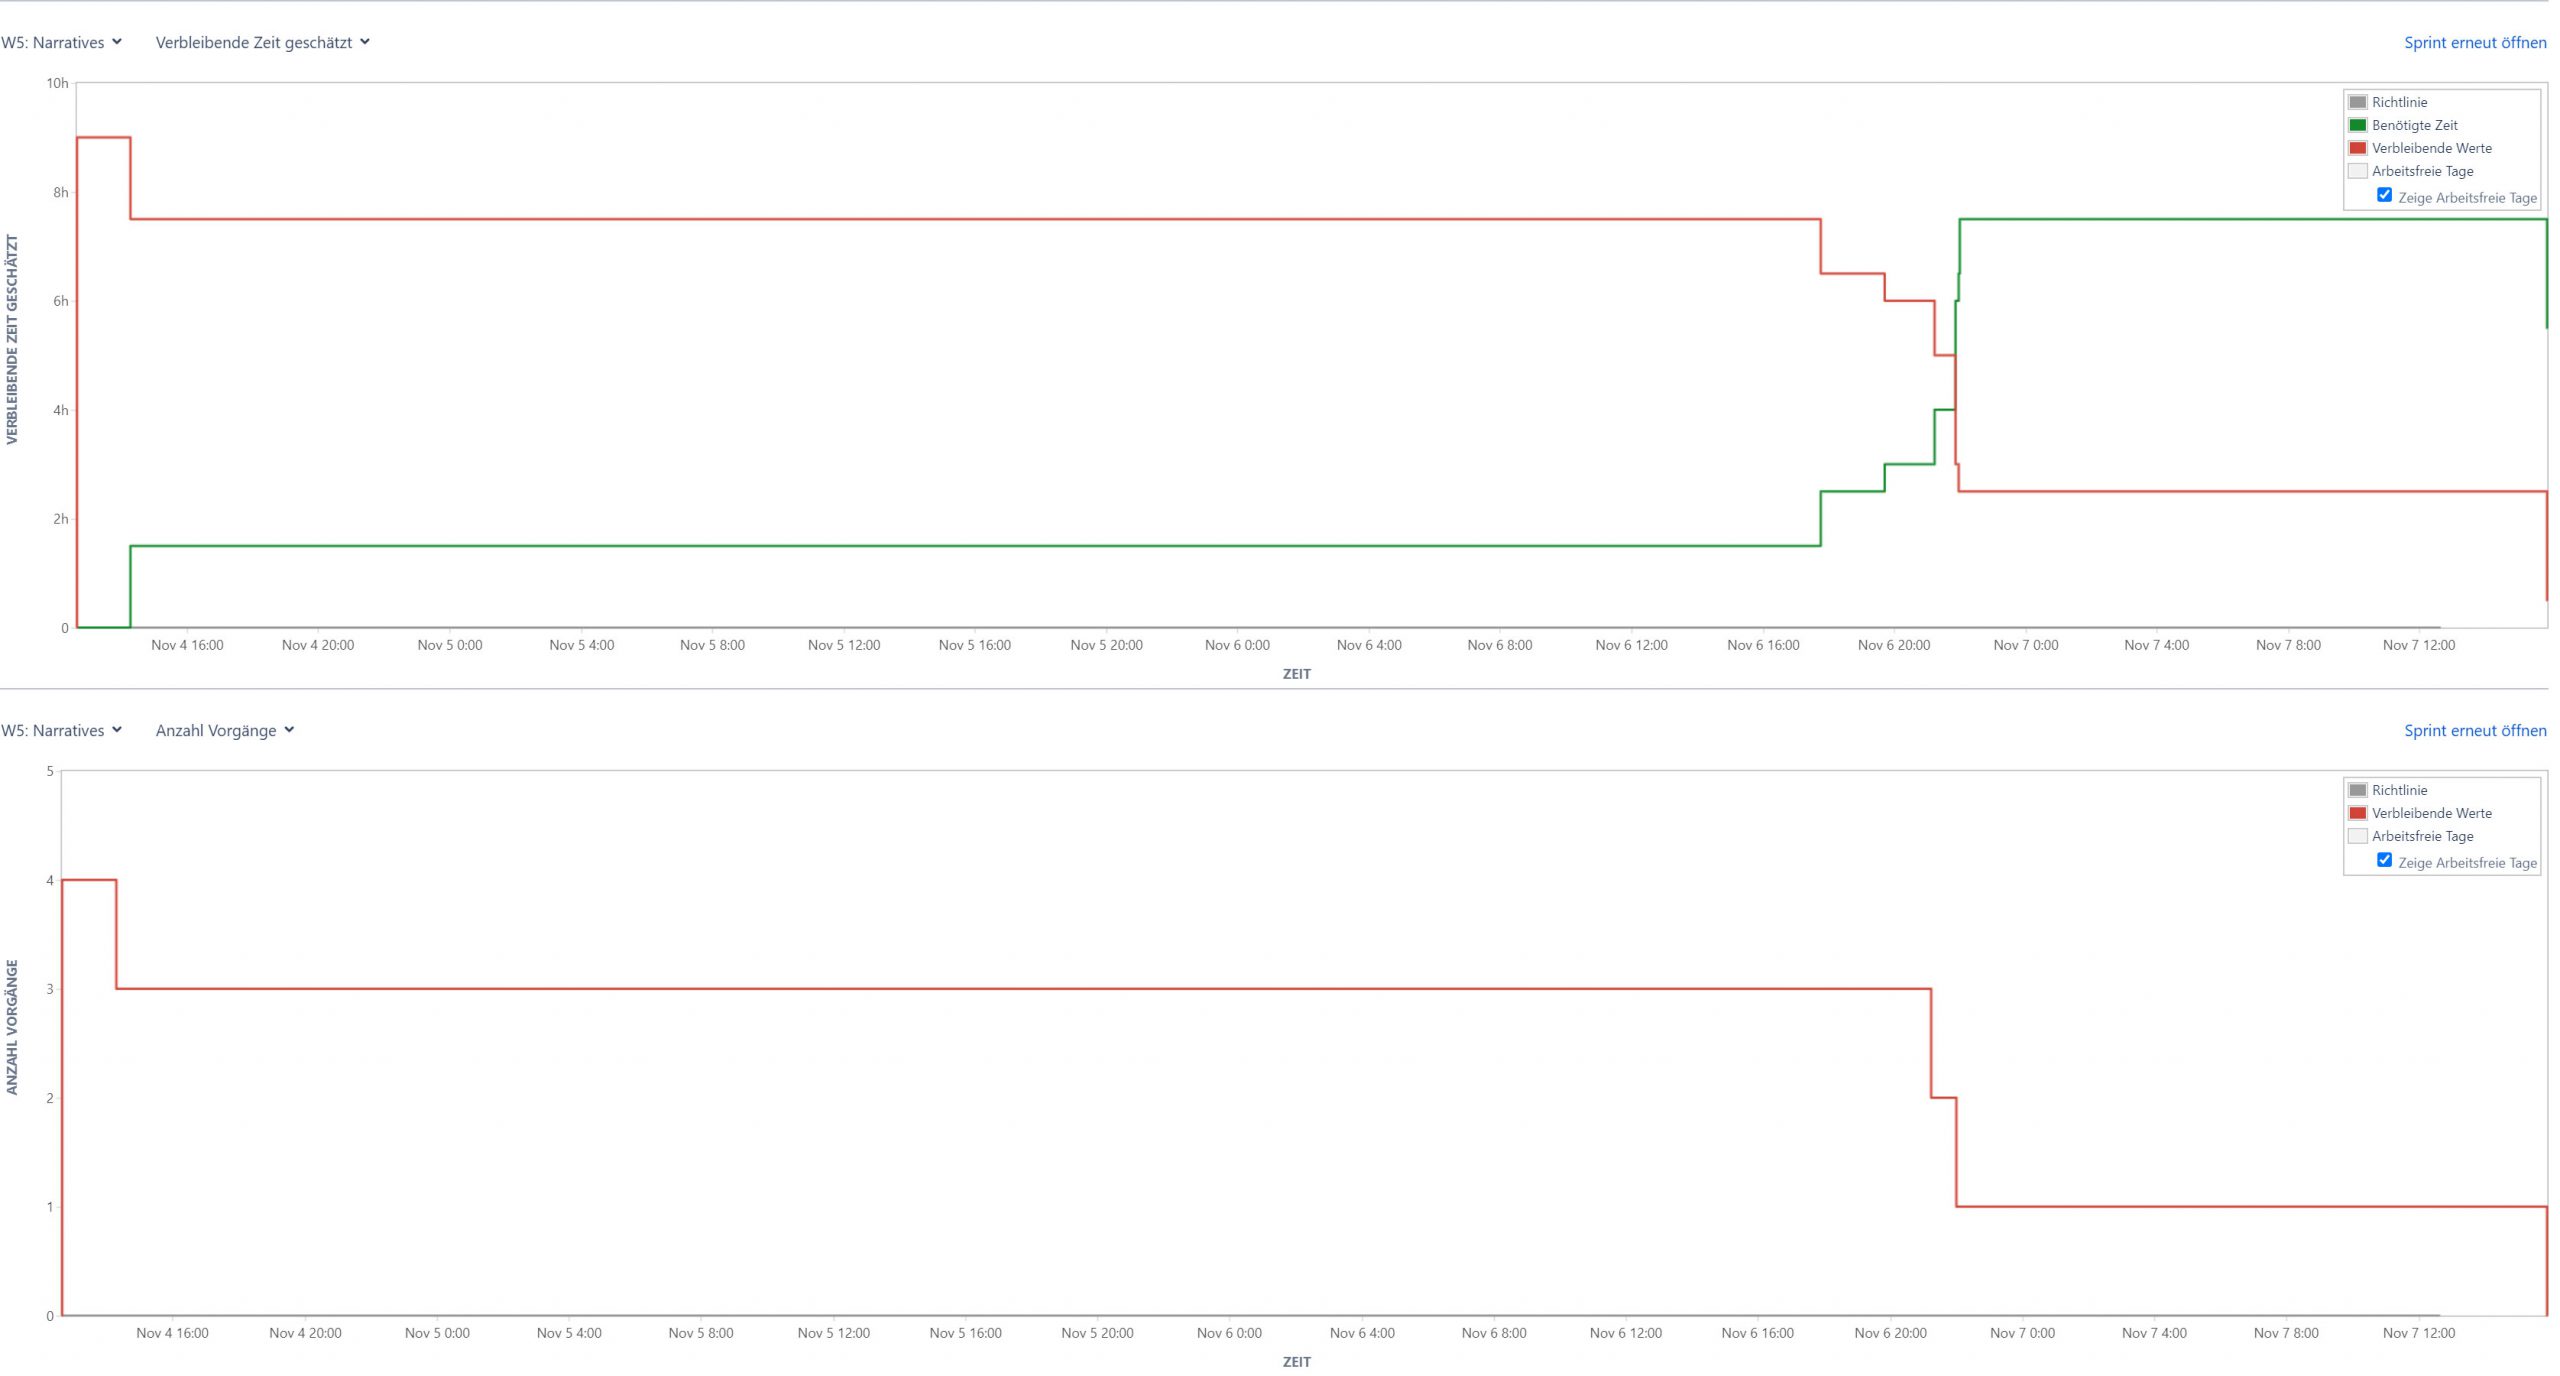
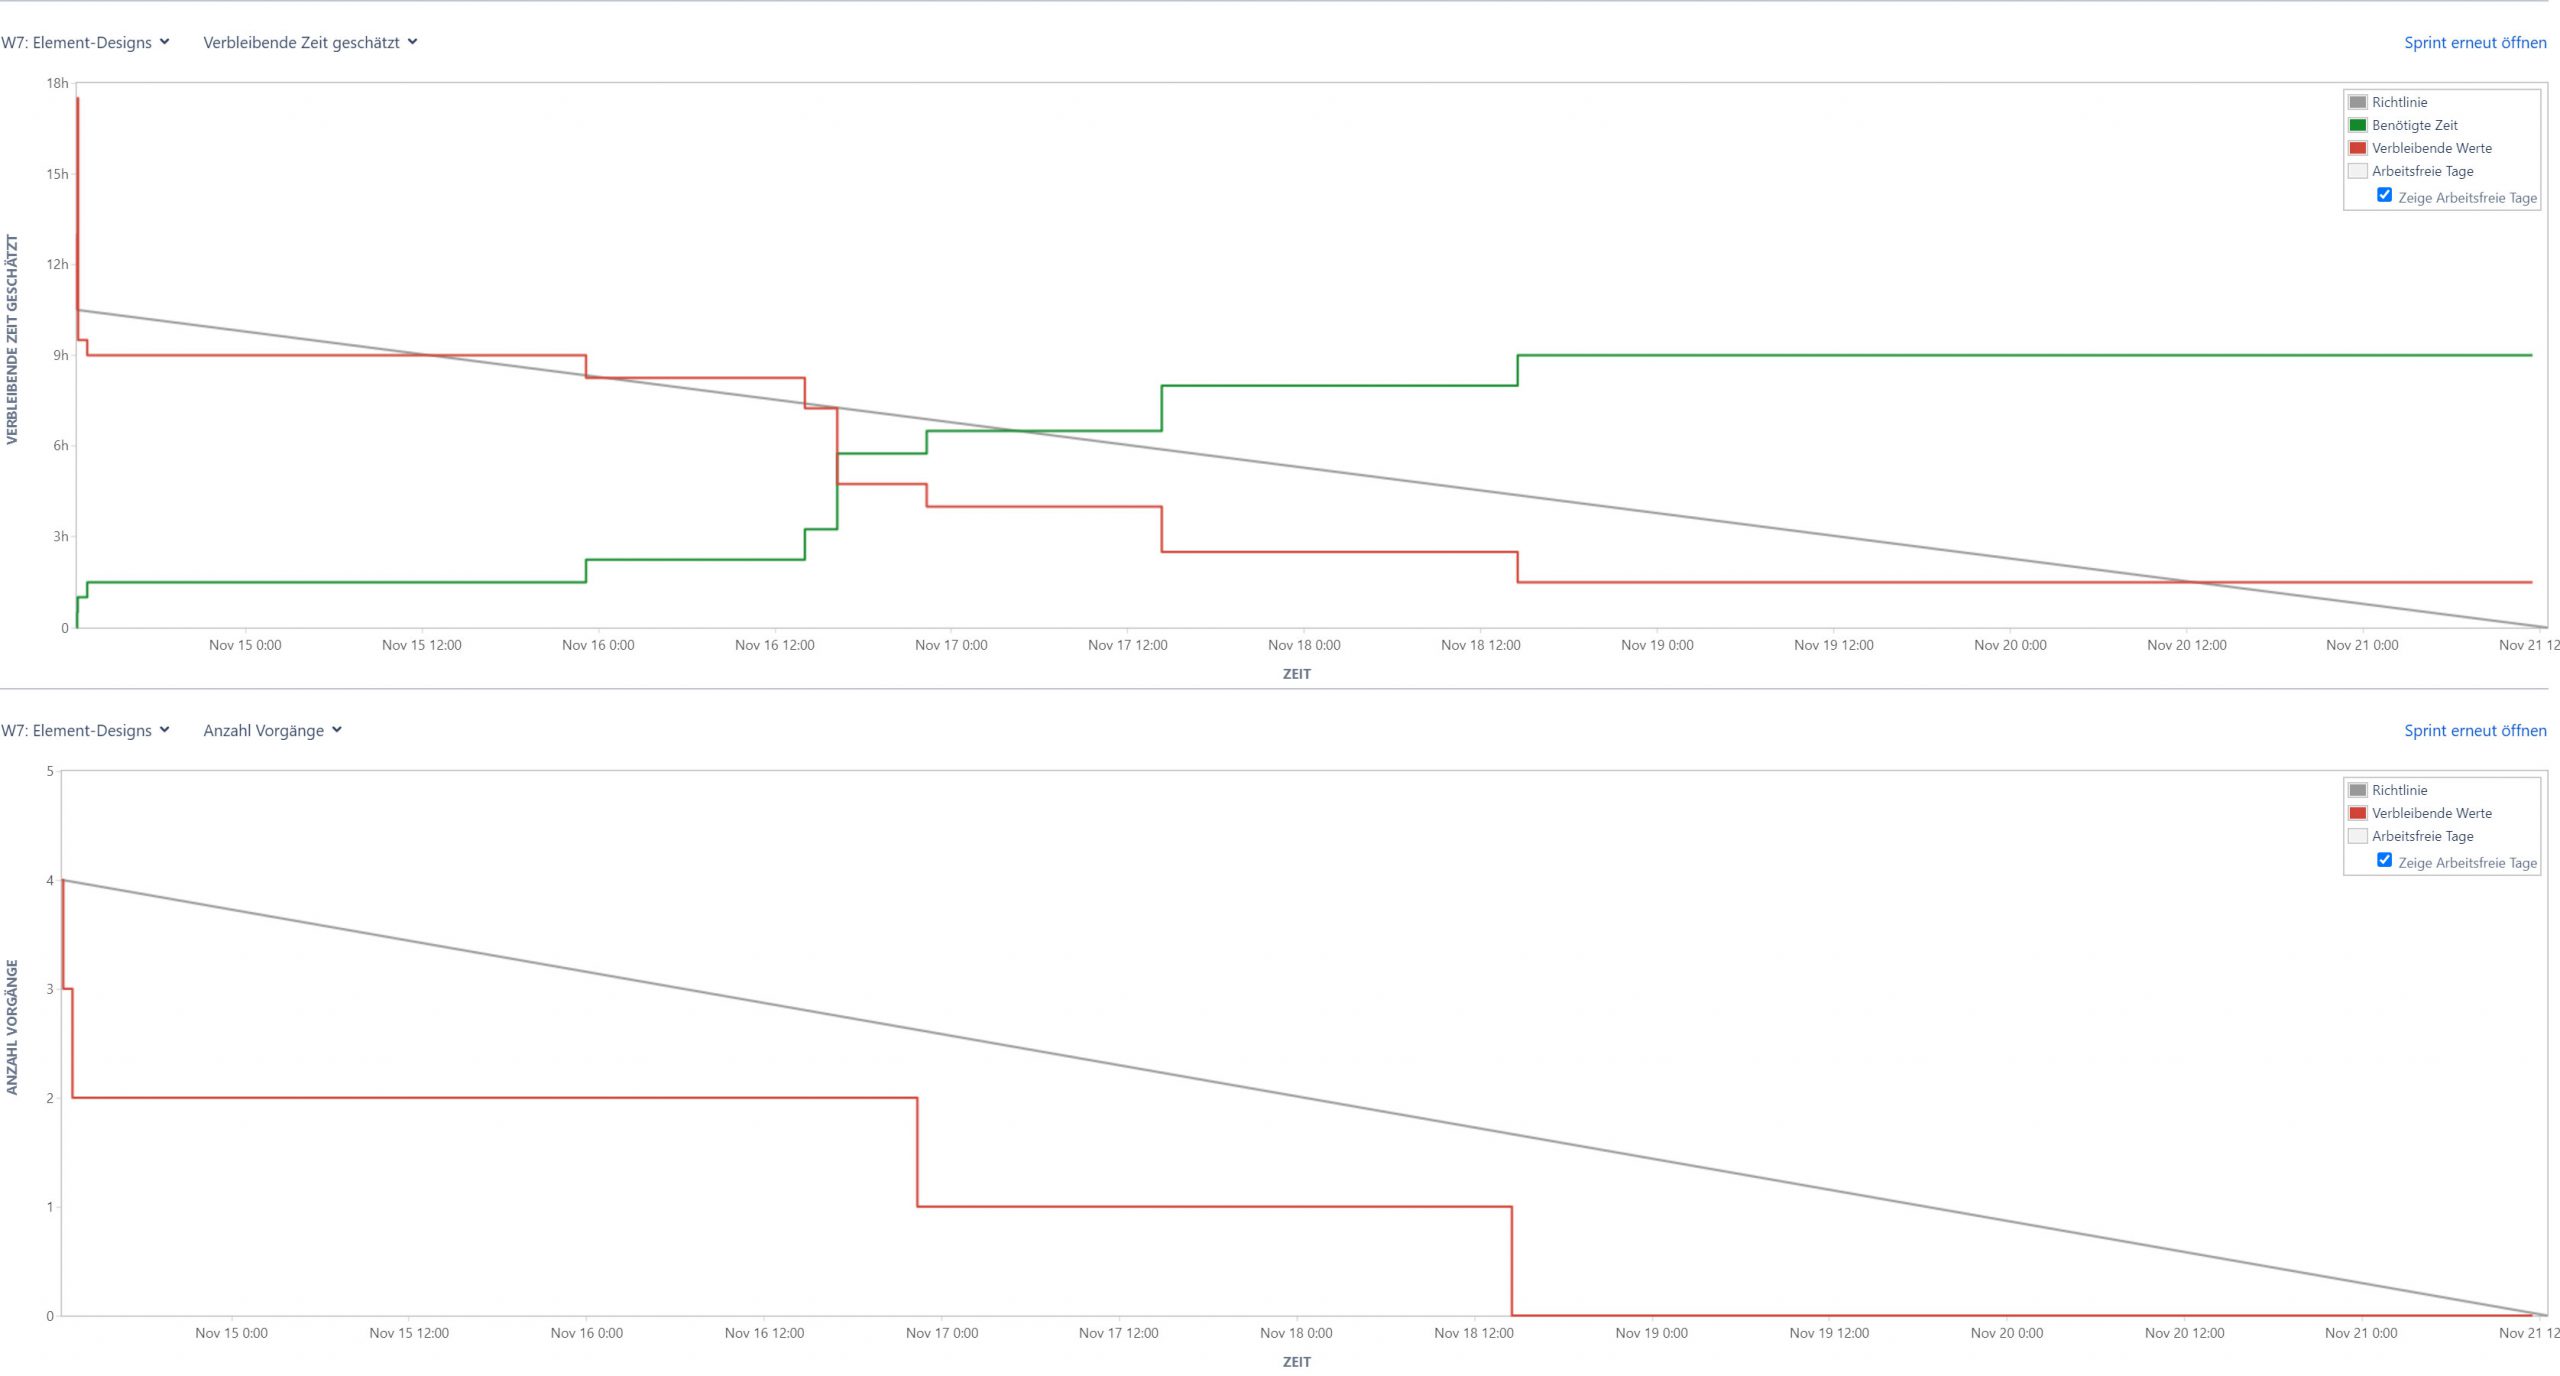
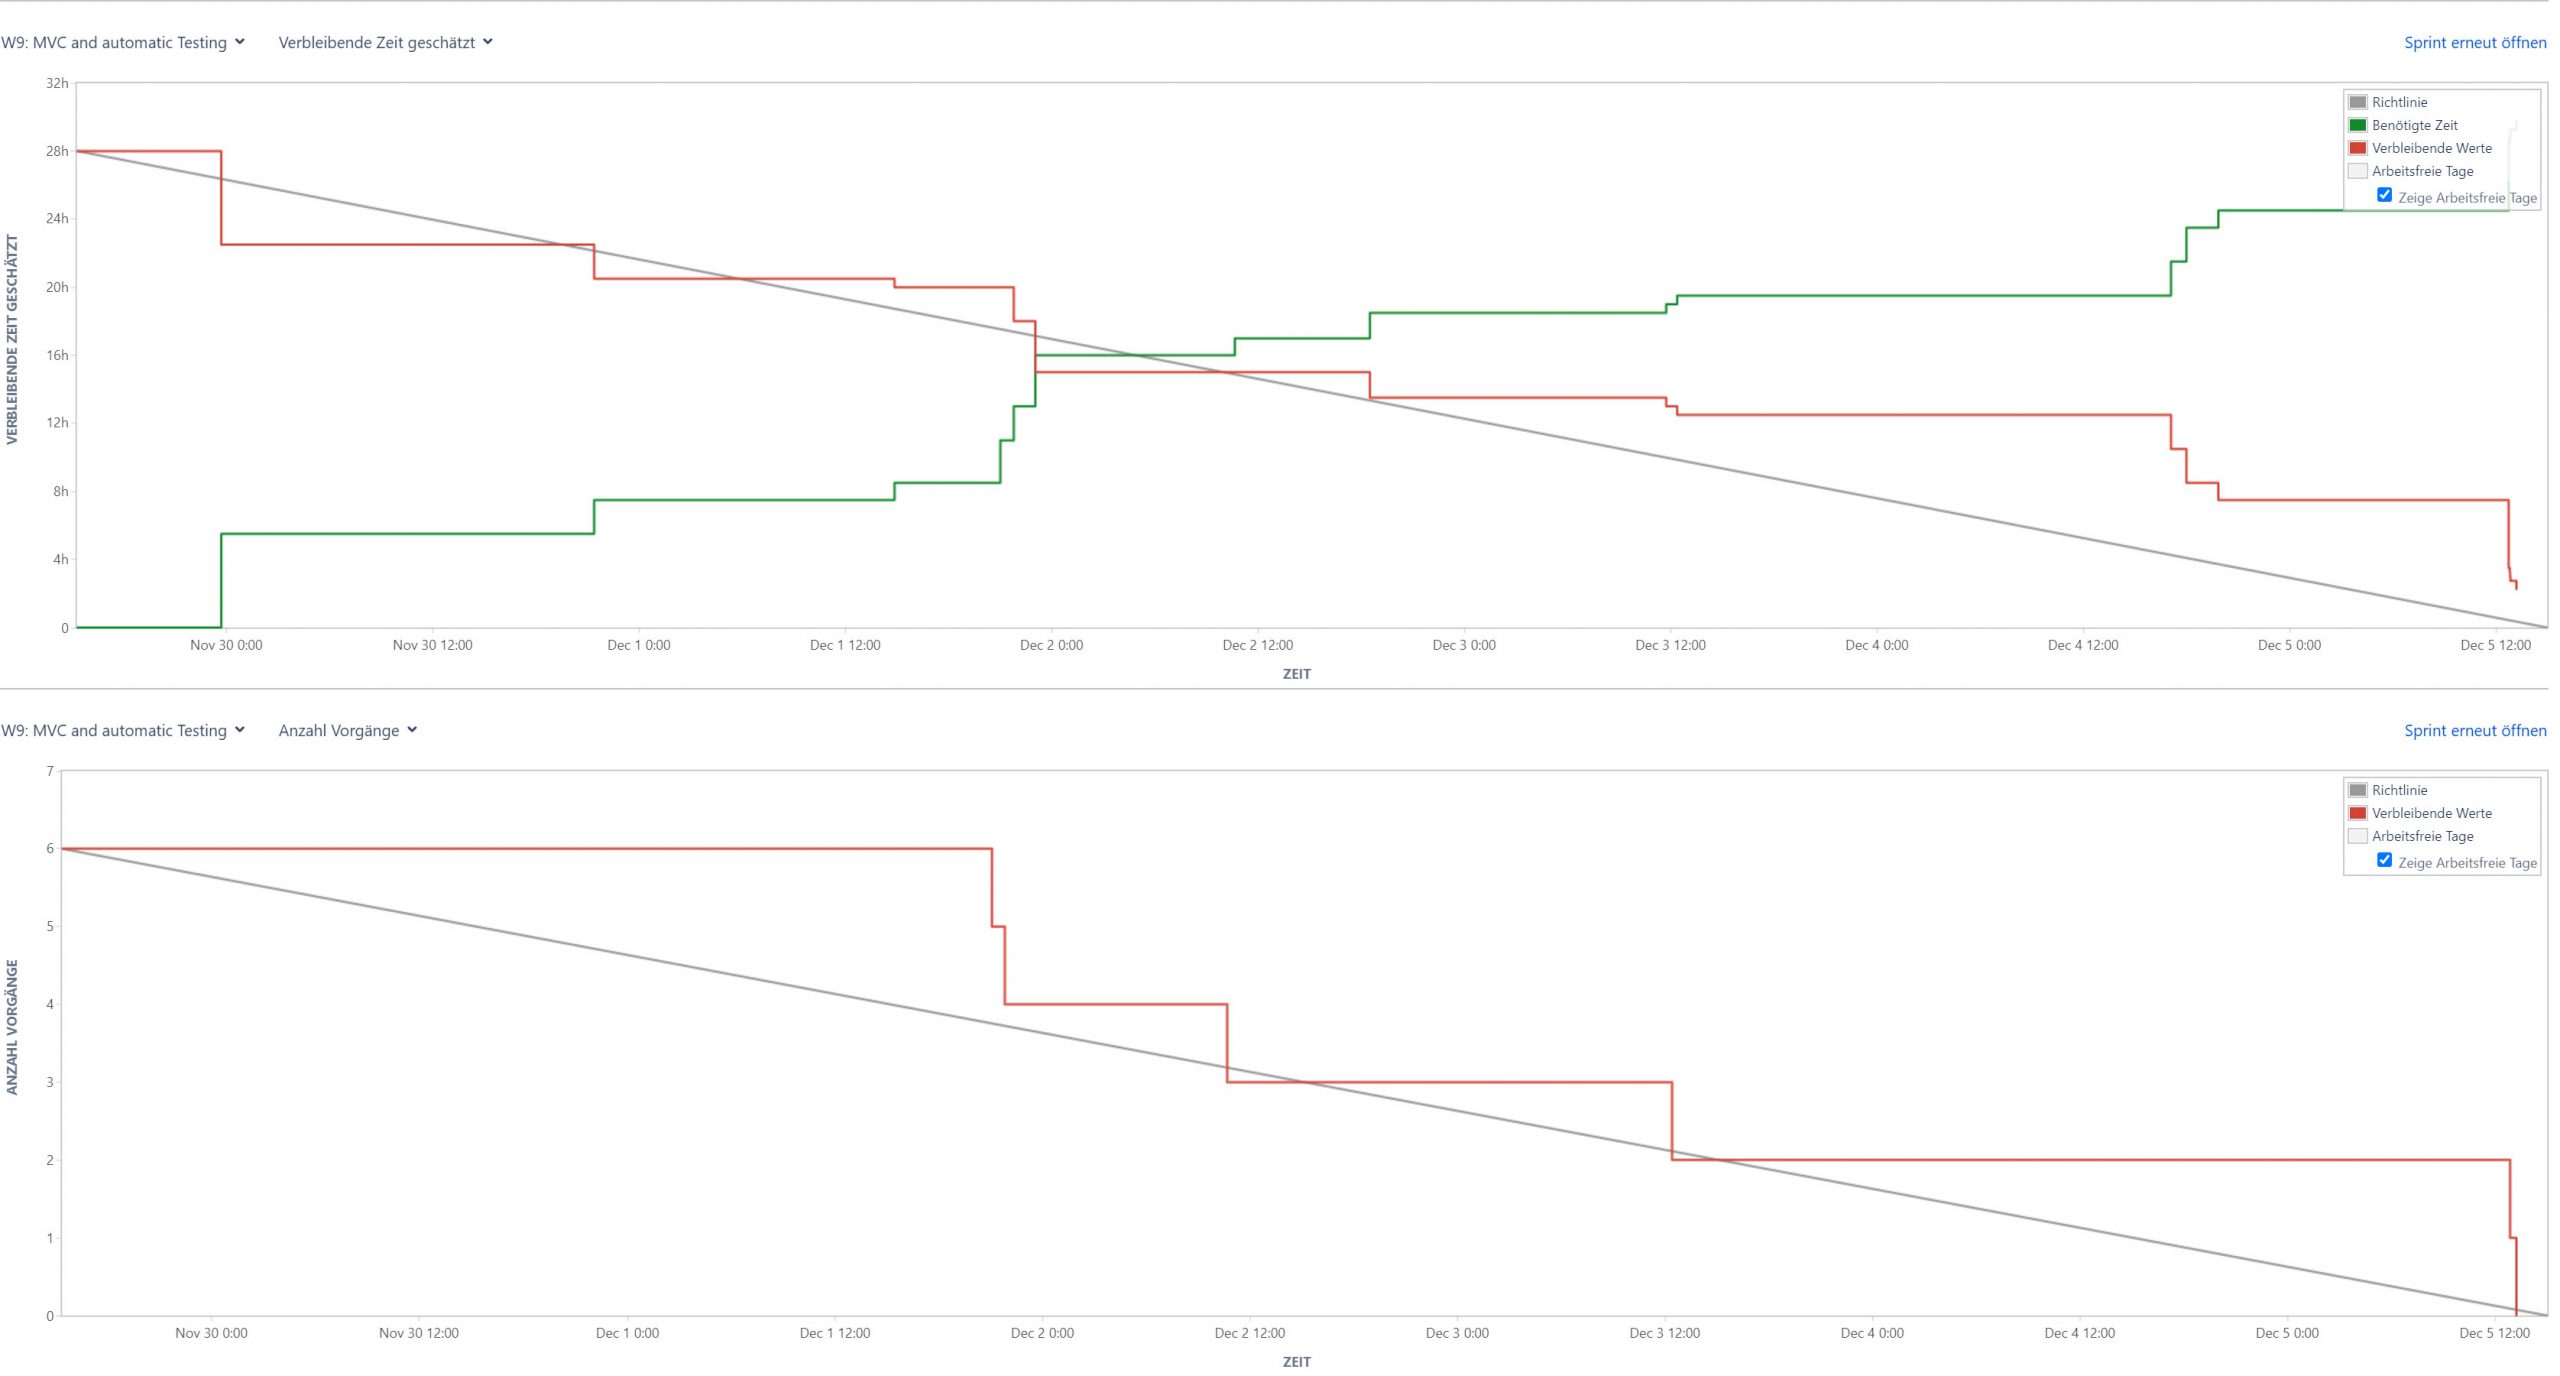
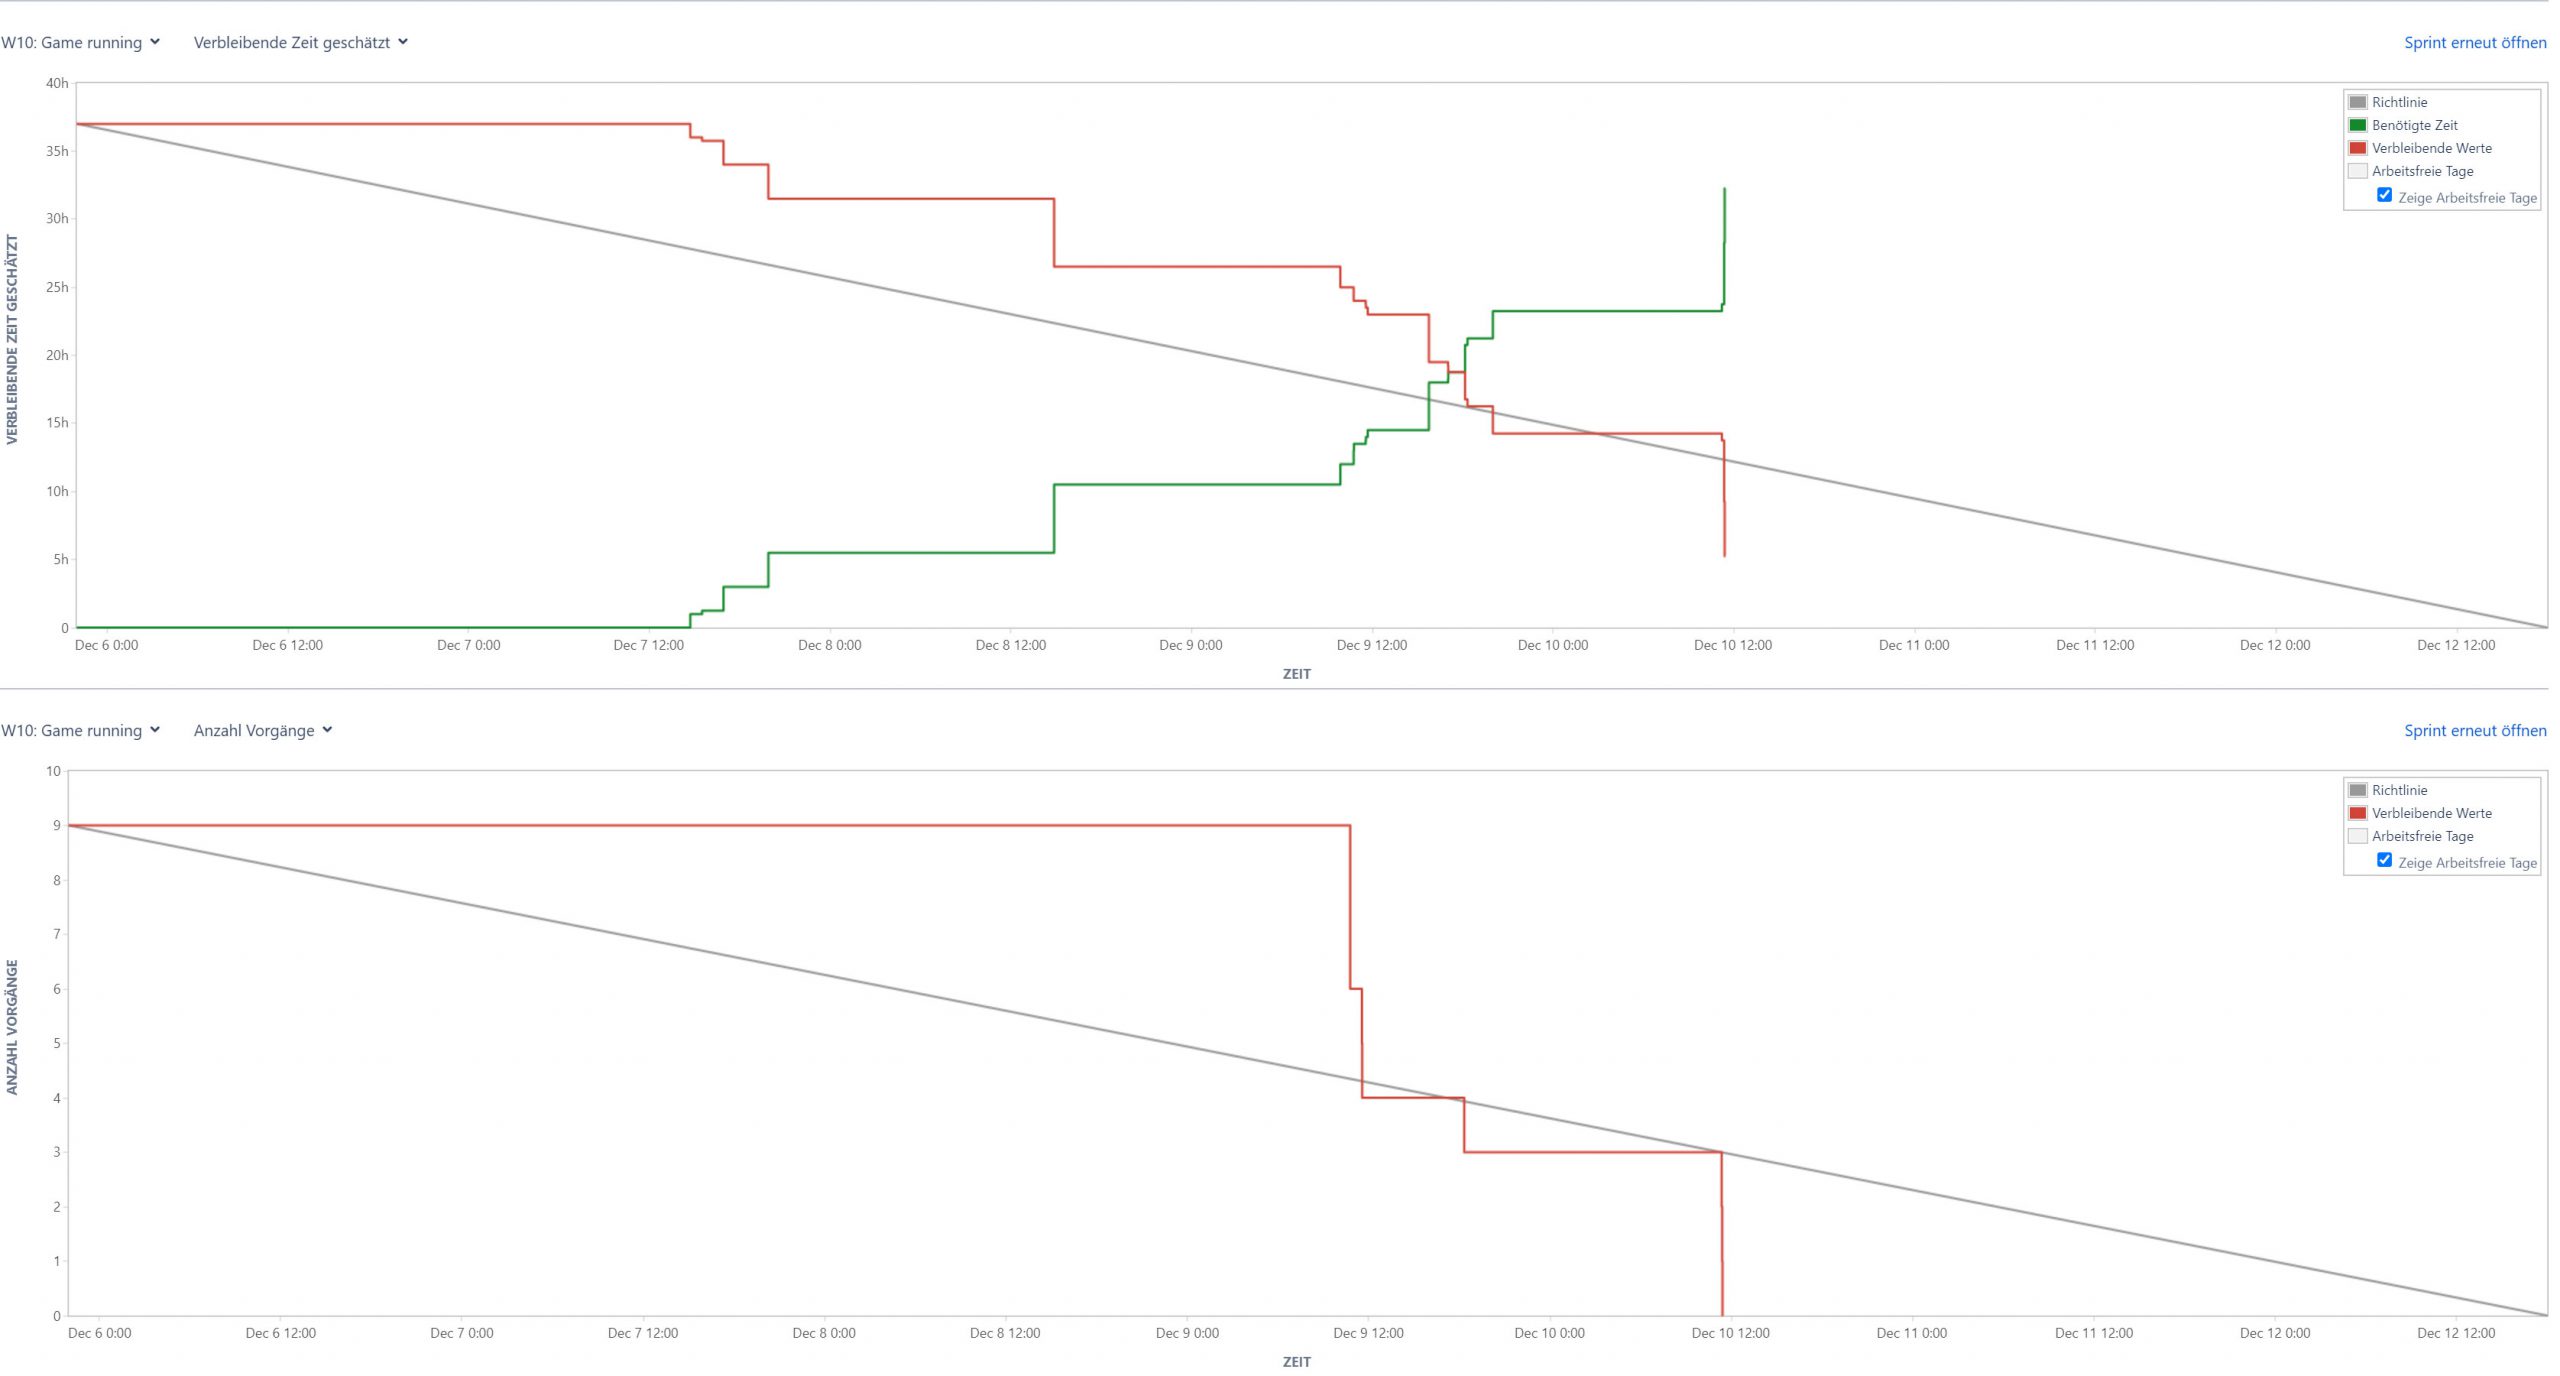
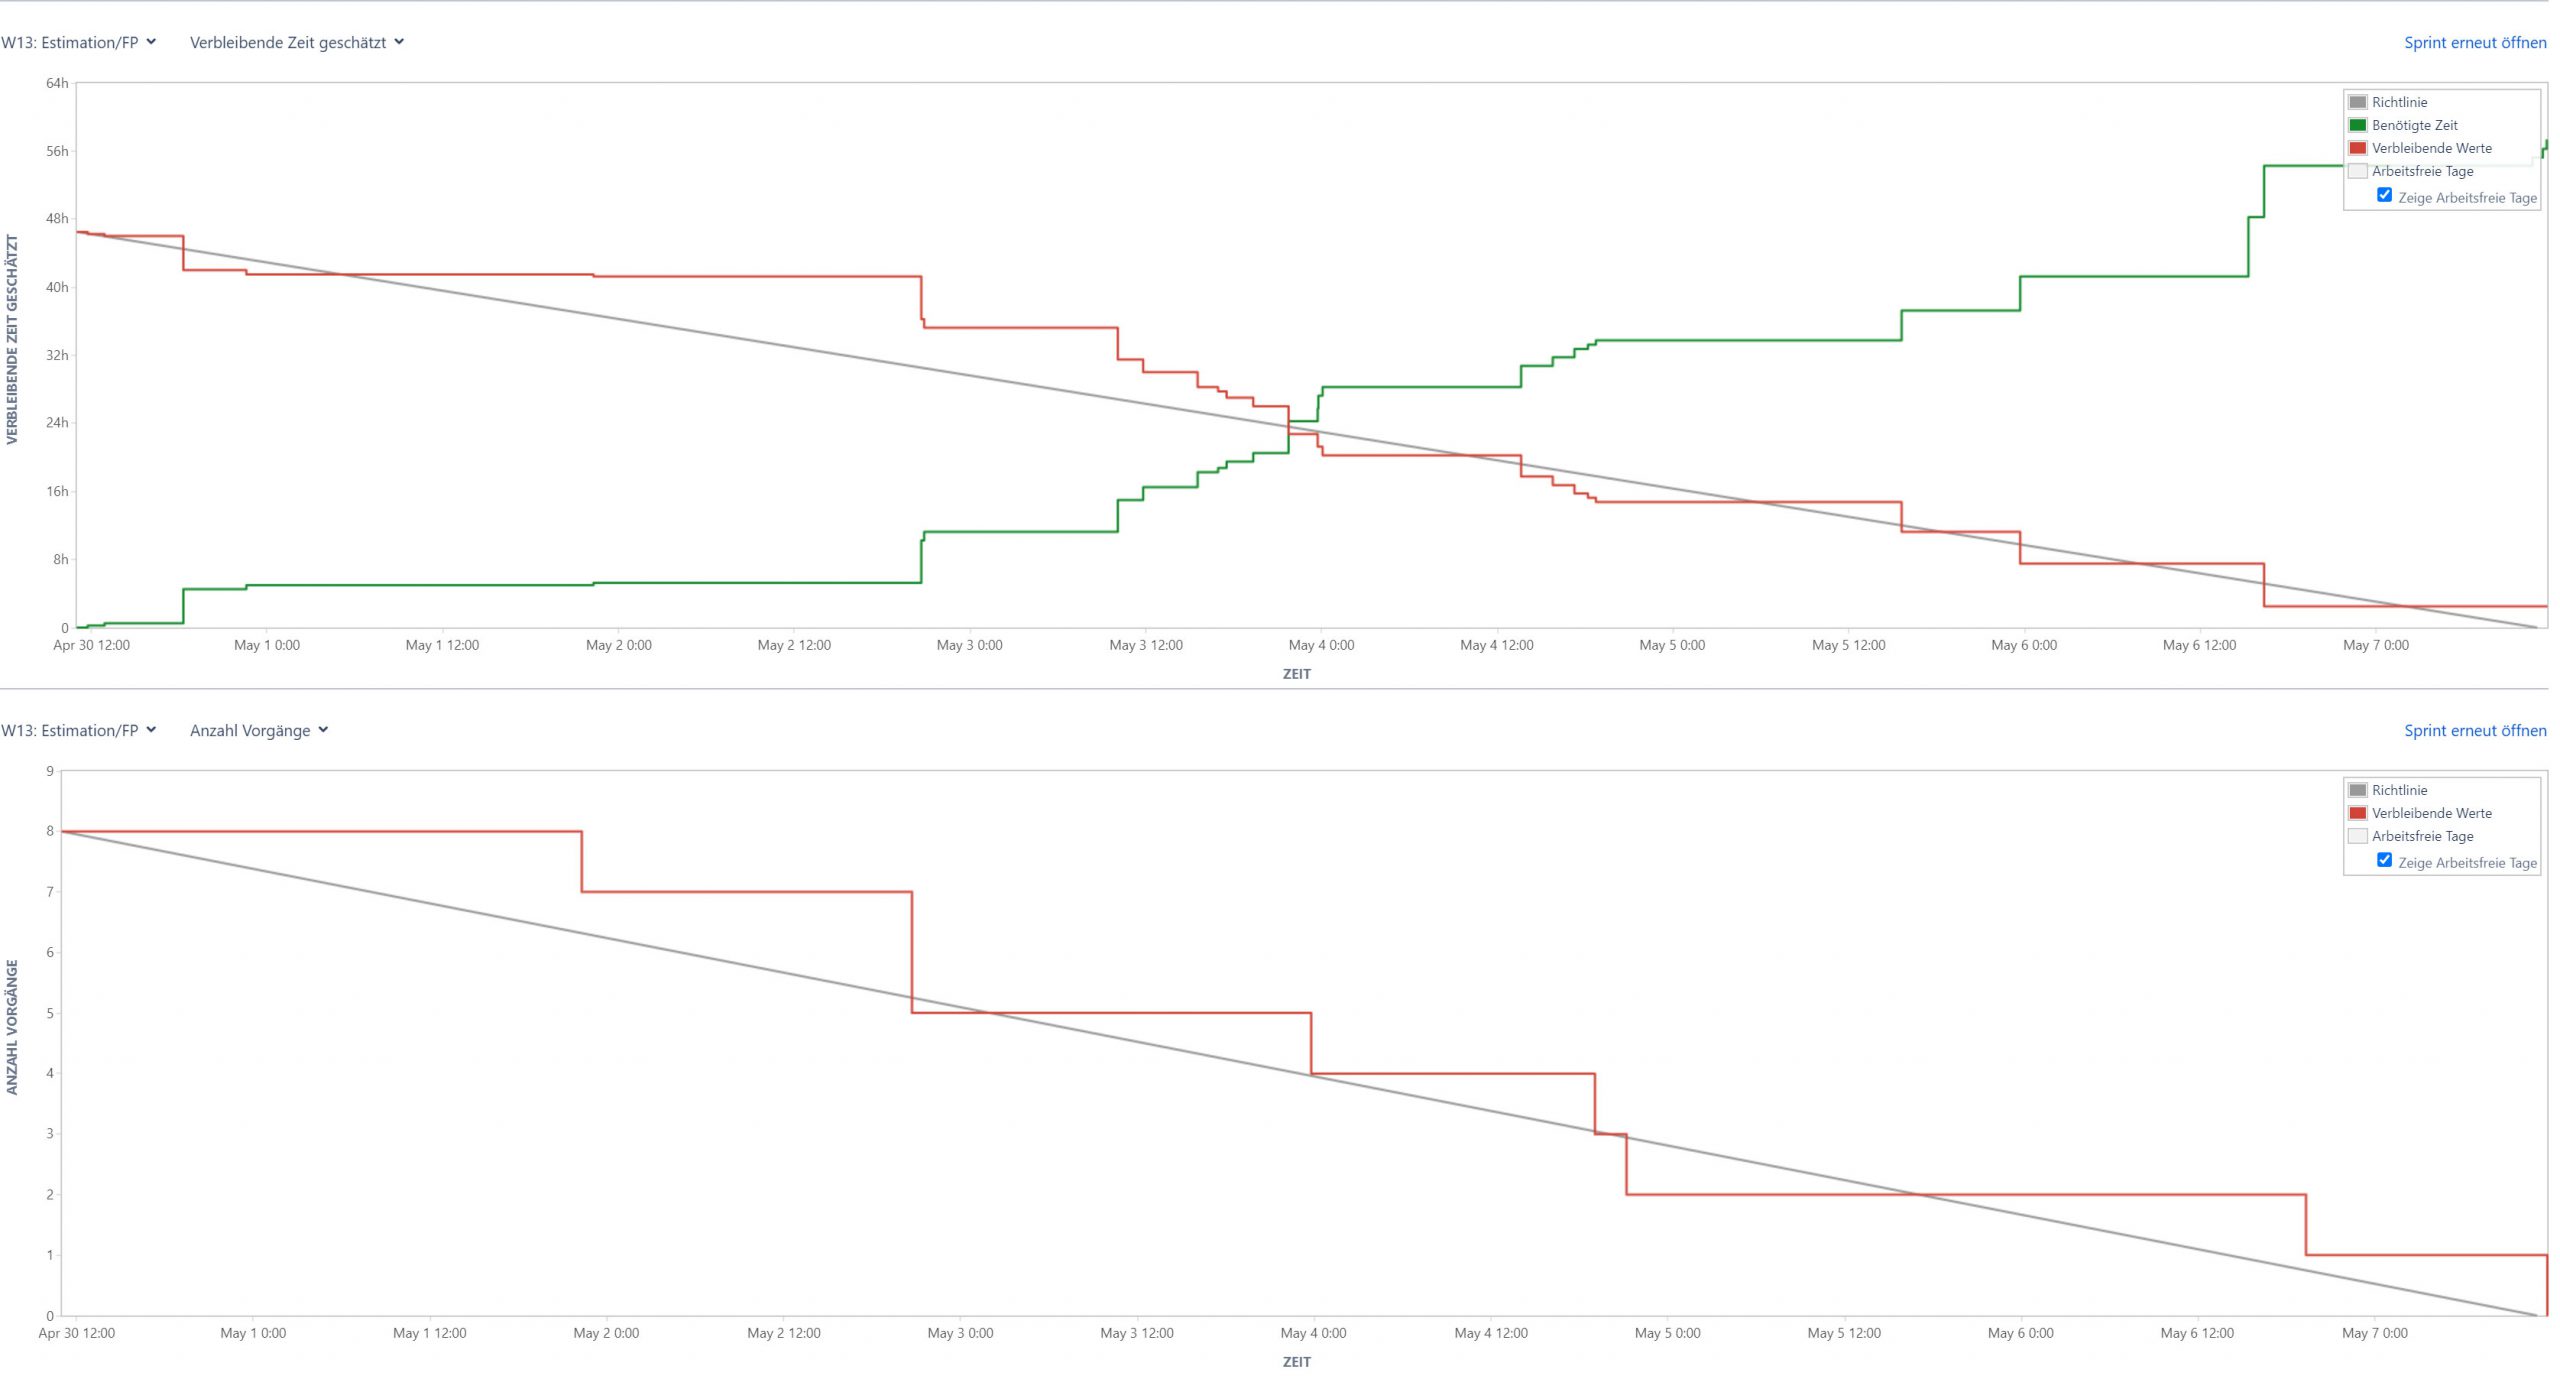
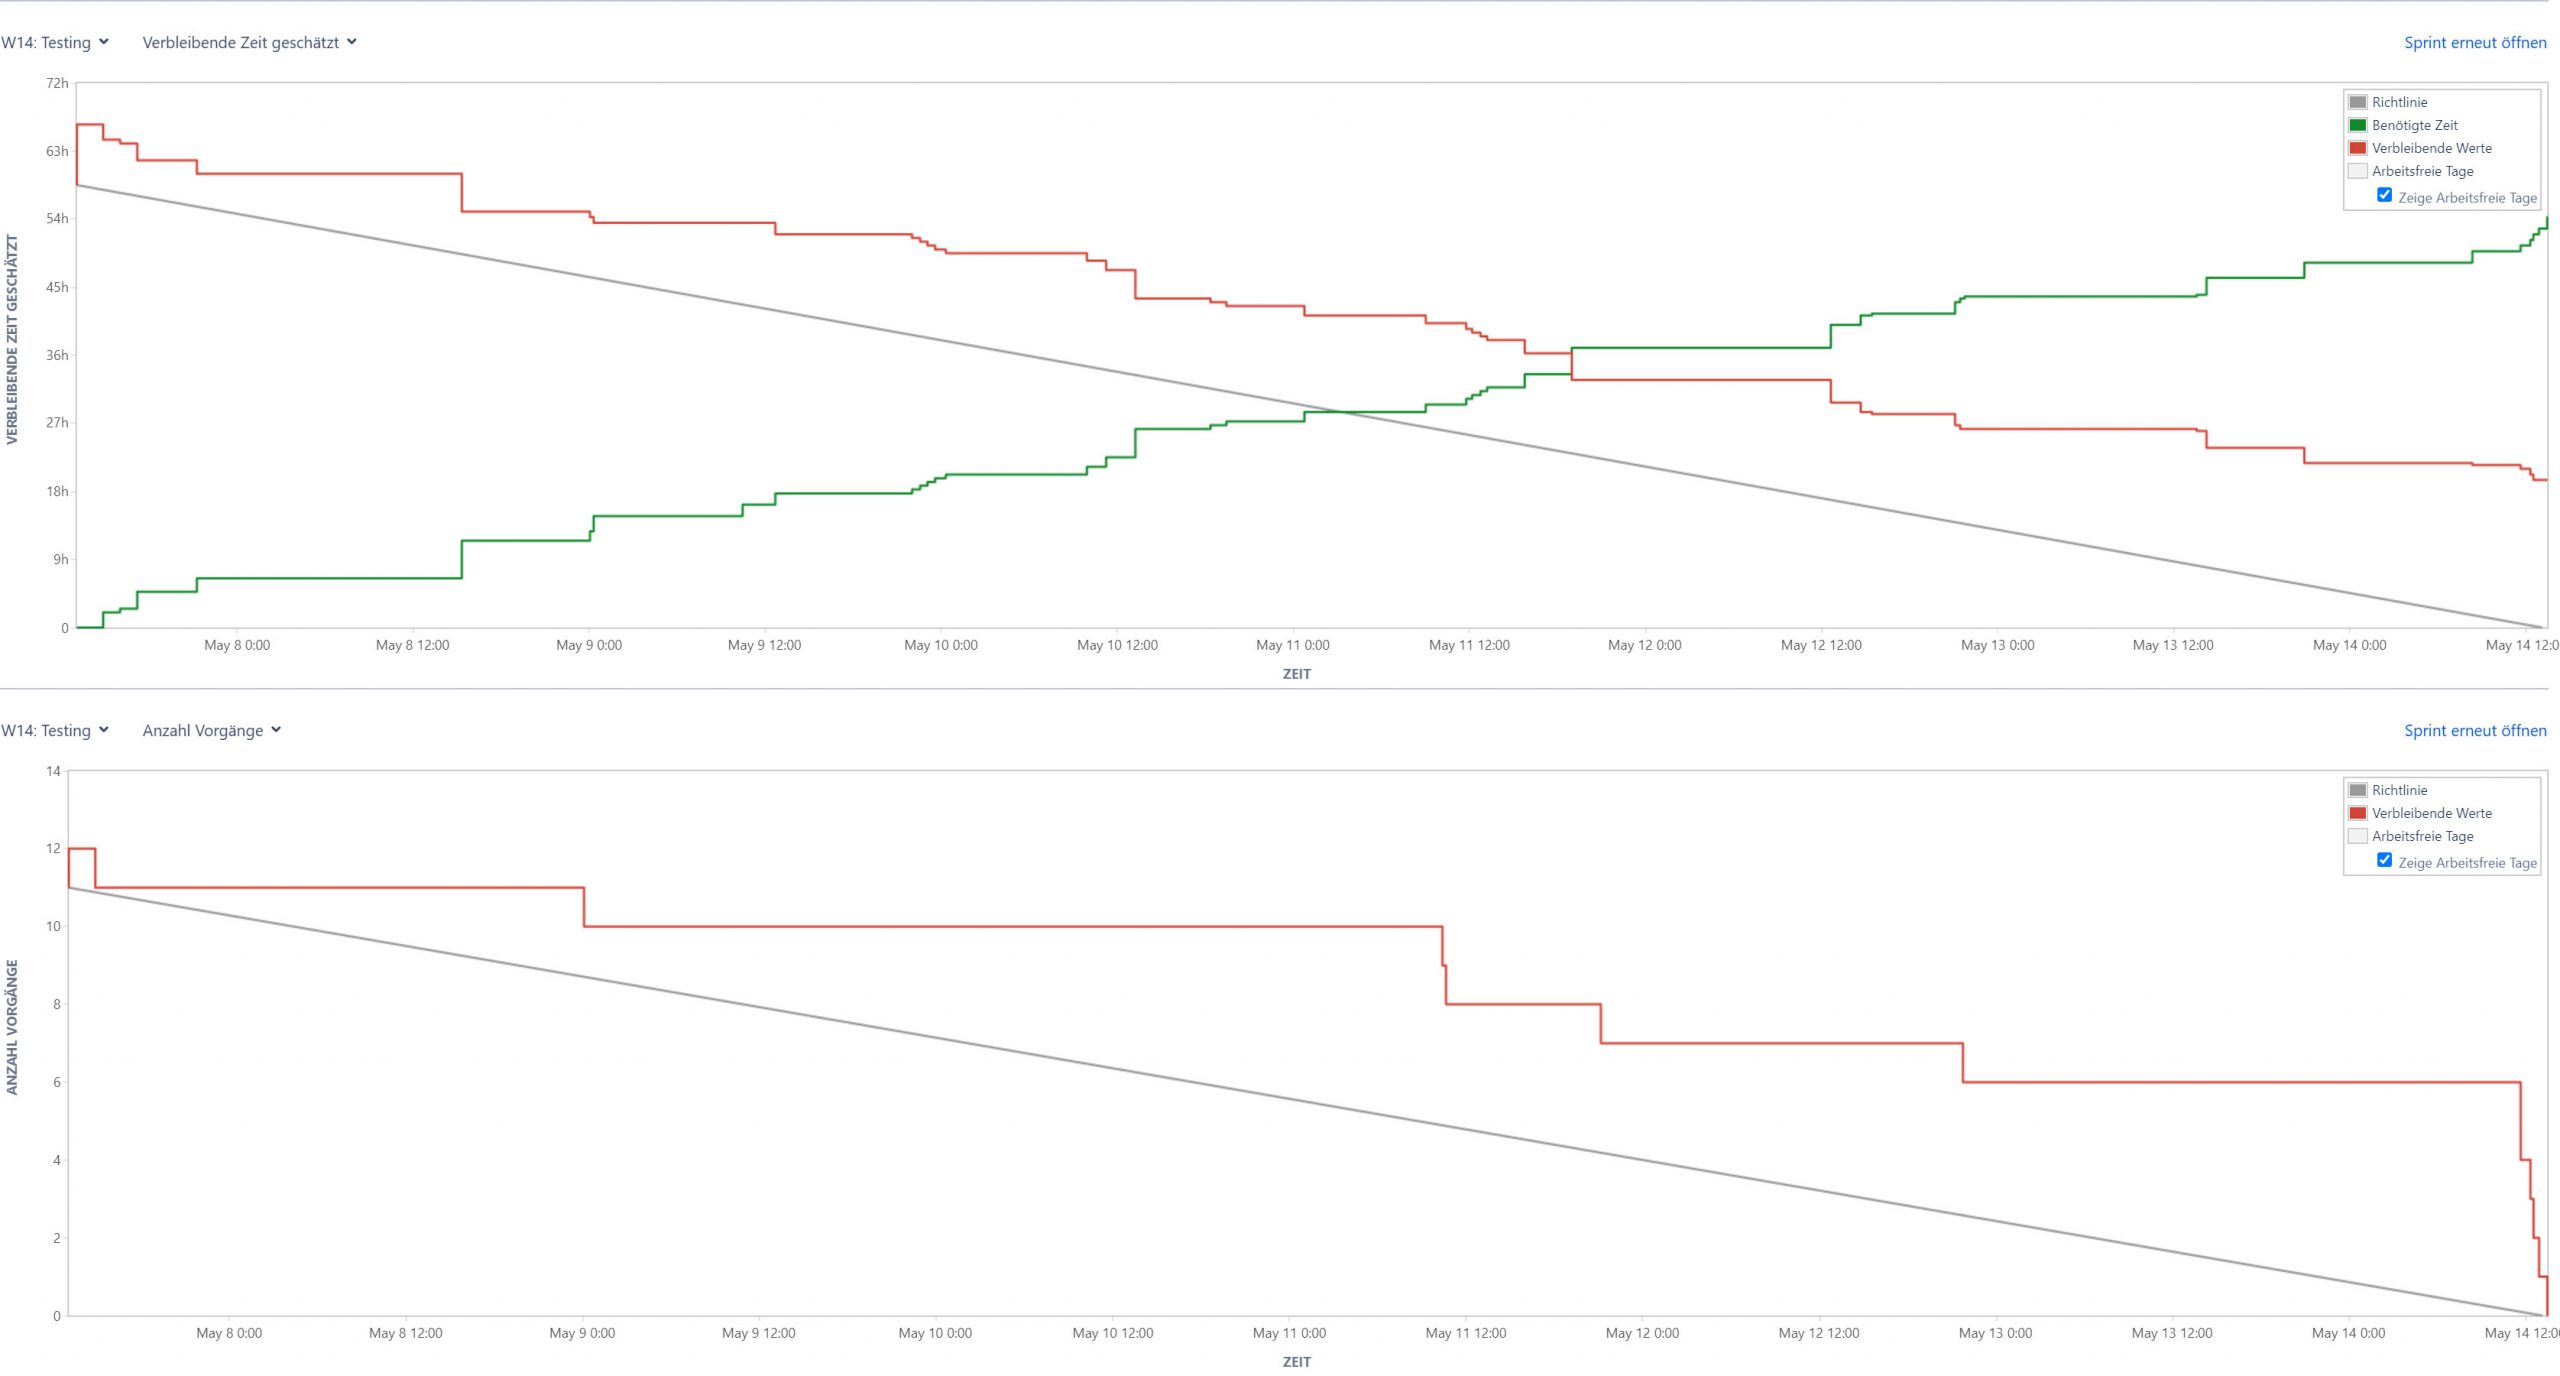
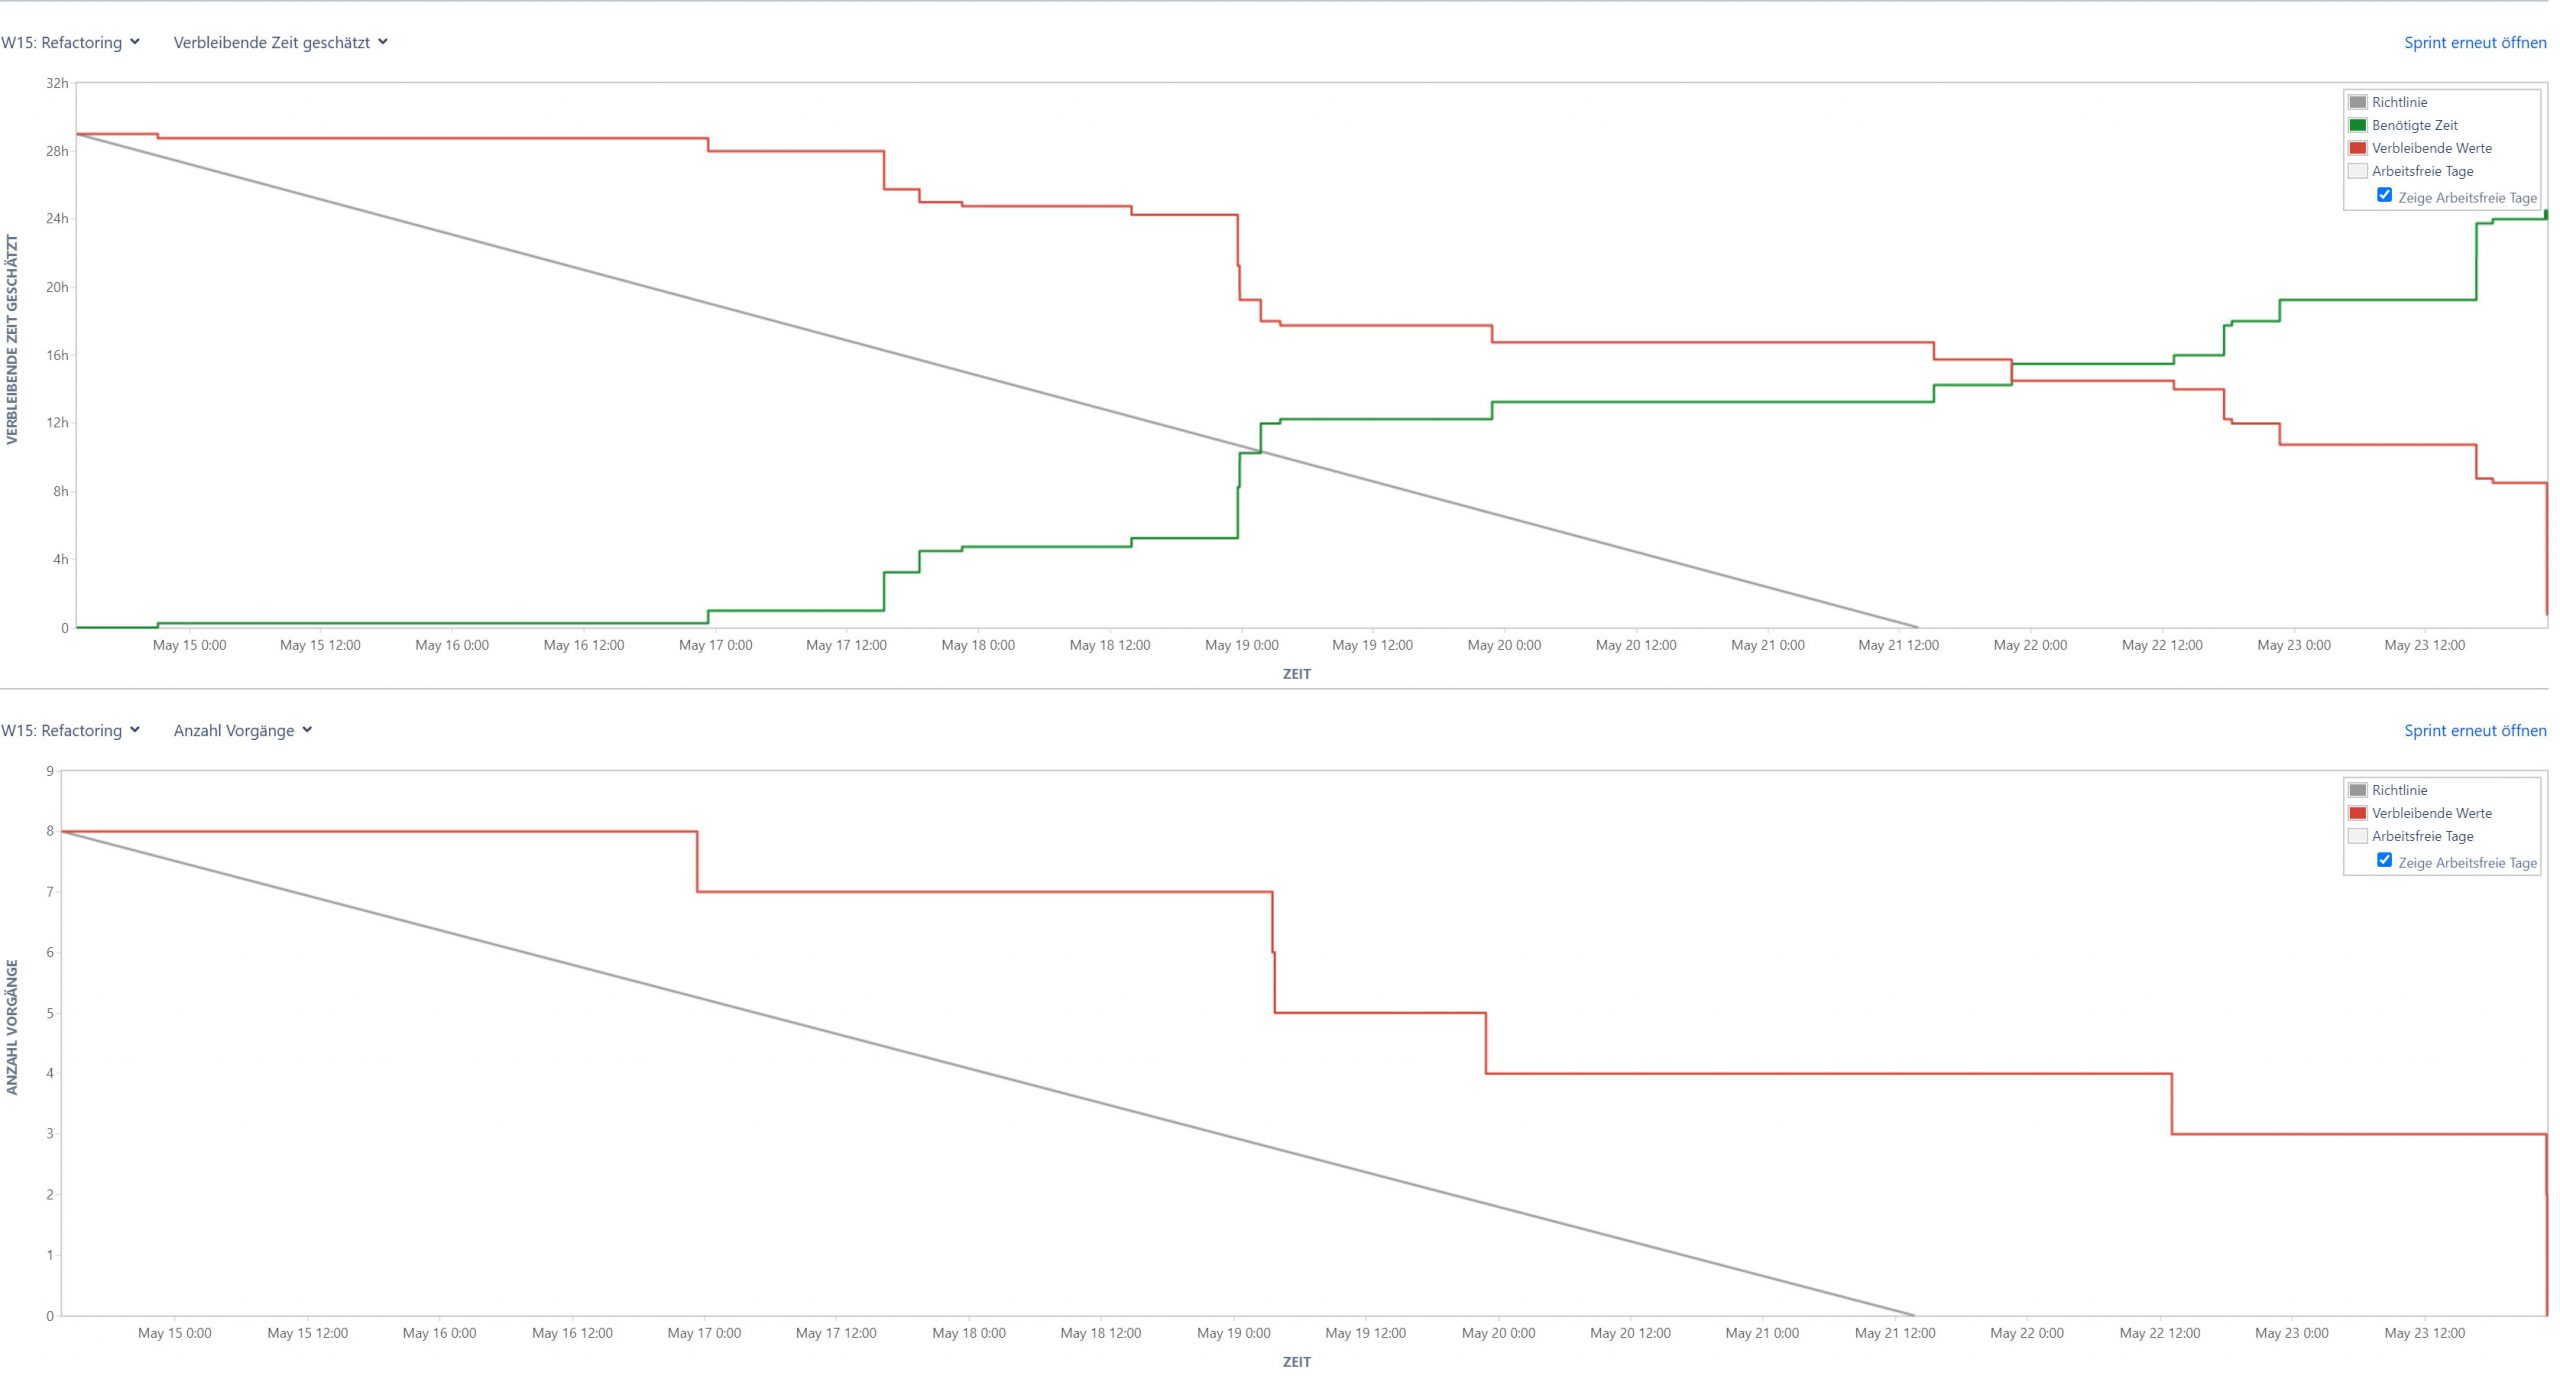
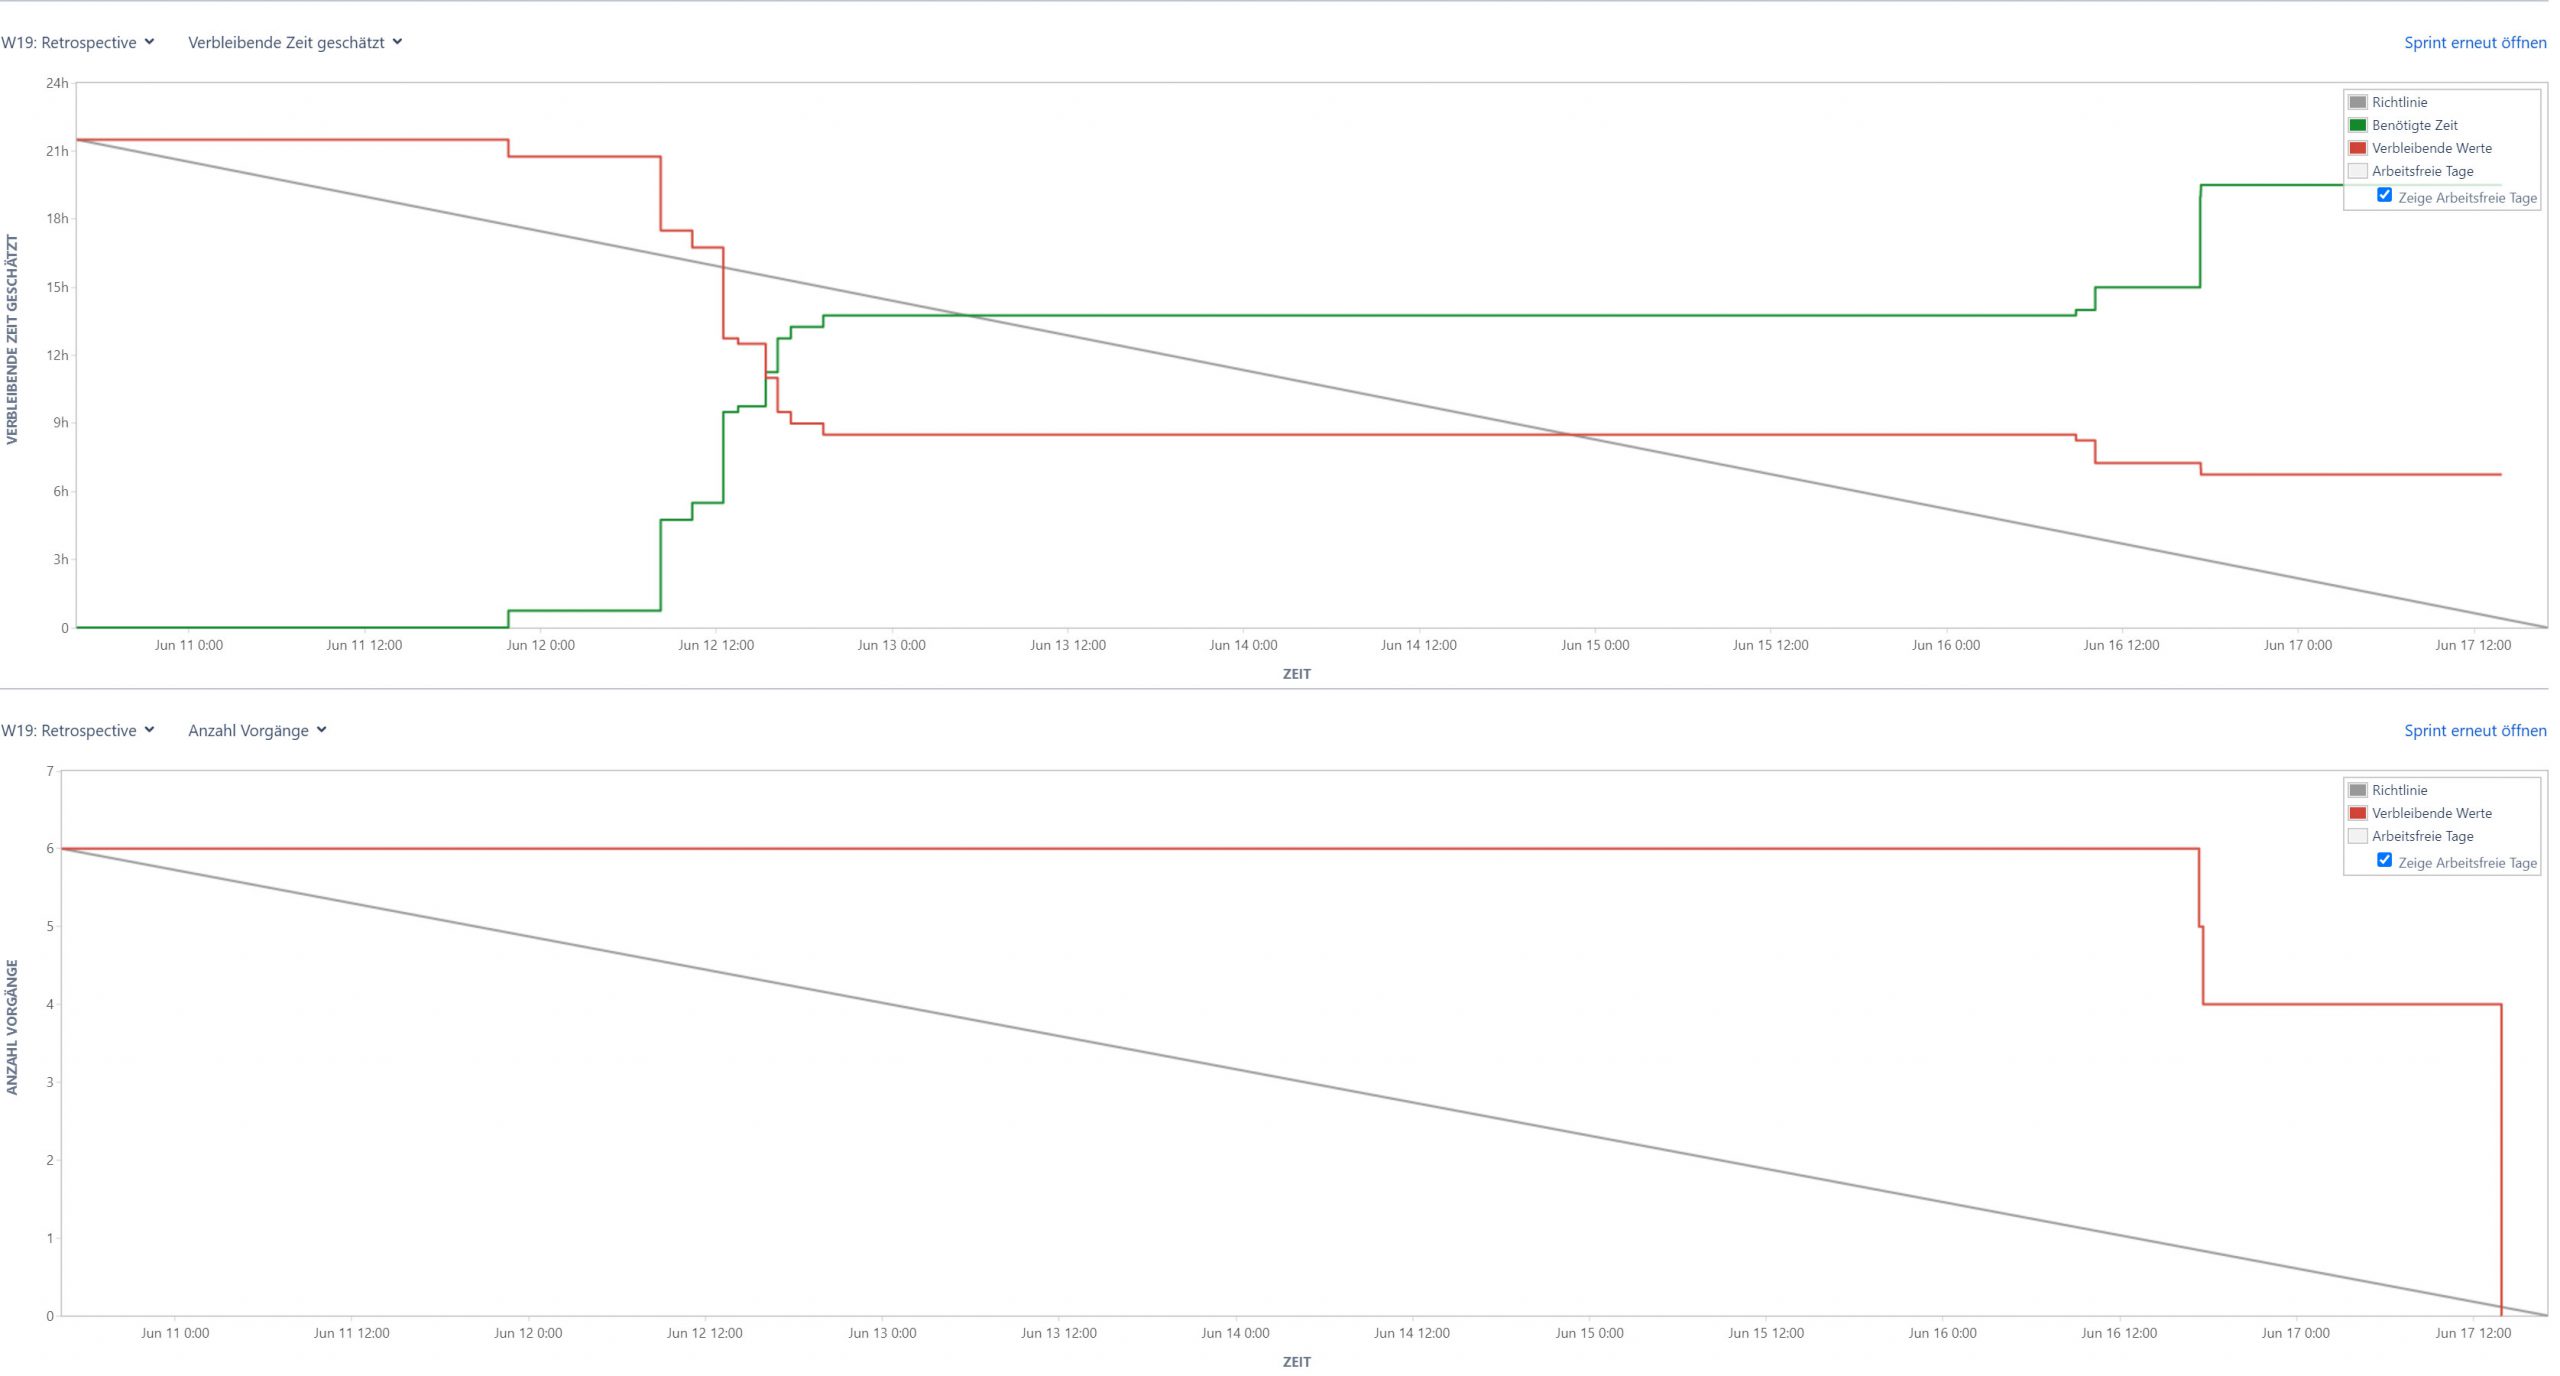
In the following, you can see our burndown-diagrams. (Click on the right to move on to the next burndown) In our opinion, the diagrams of week 13 and 21 look best.

Function Points - Estimation

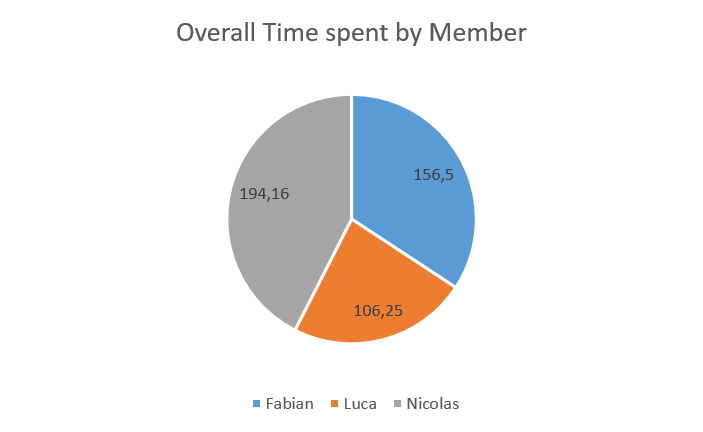
Function Points - Time Spent

Time spent by Sprint

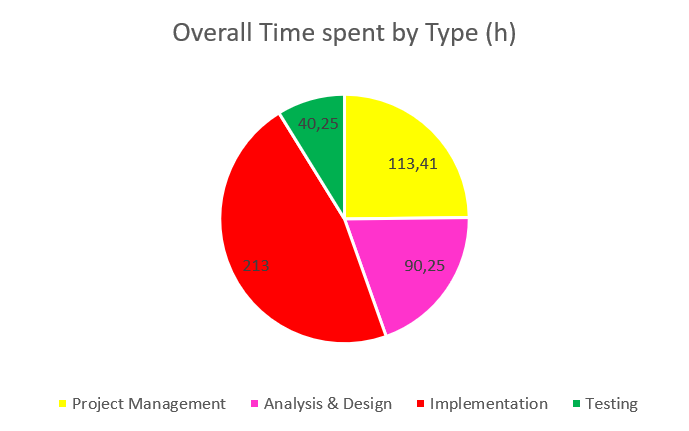
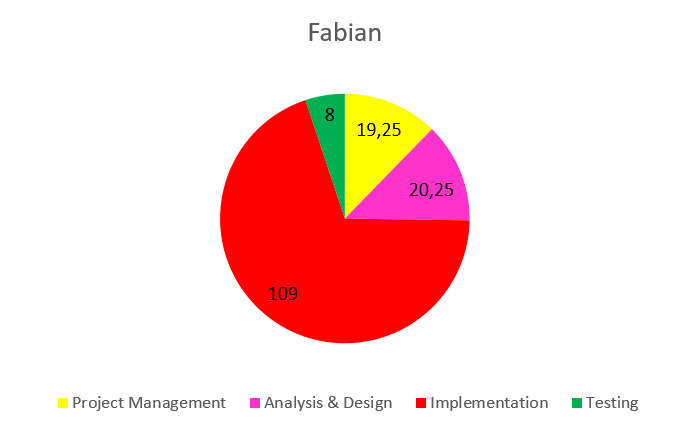
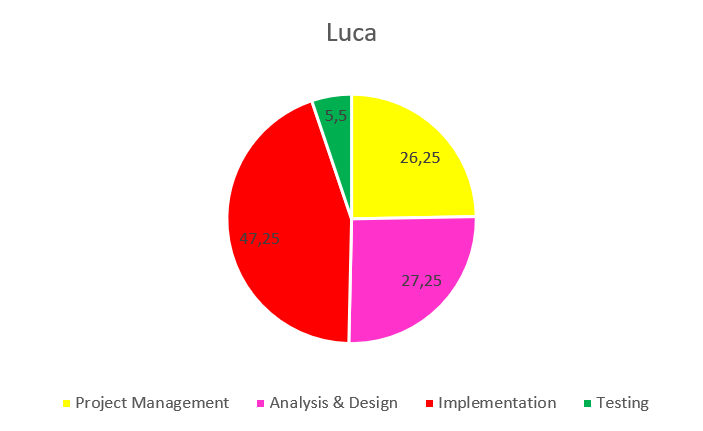
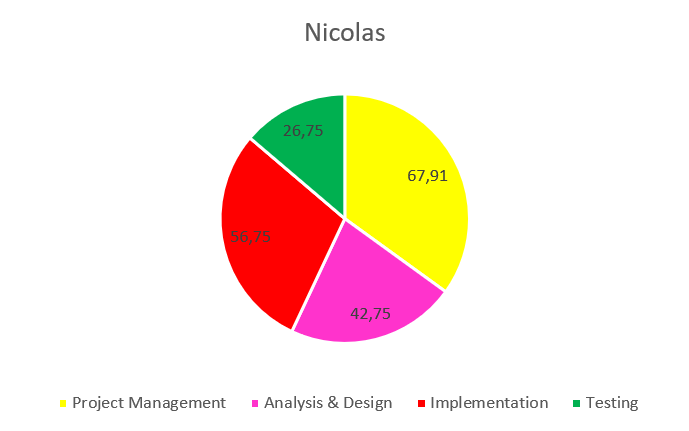
Time spent by Phase
