Function Points - What's that?
Welcome to our blog entry of week 13. Today, we mainly want to present the function point calculations and our estimation to you.
First of all: What are "Function Points" and what are they useful for?
In every project, estimation and planning are very important aspects. Most often, it is difficult to estimate the workload of a ticket or a use case according to one's "gut feeling". Because of that, tools and methods such as functions points or story points exist.
Summarized, several aspects are considered for each use case while calculating the function points. One differentiates the following aspects:
- EI: External Input
- EO: External Output
- EQ: External Queries
- ILF: Internal Logical Files
- EIF: External Interface Files
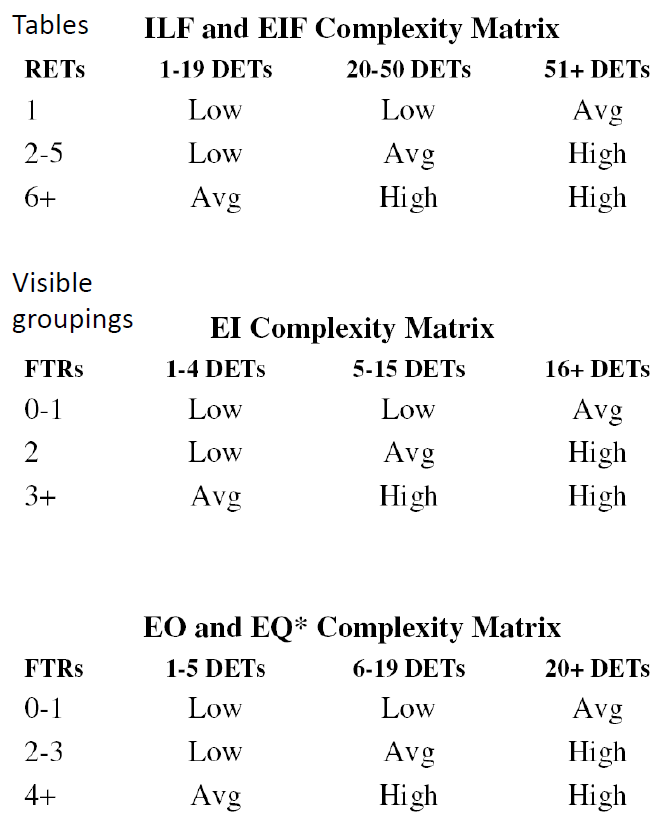
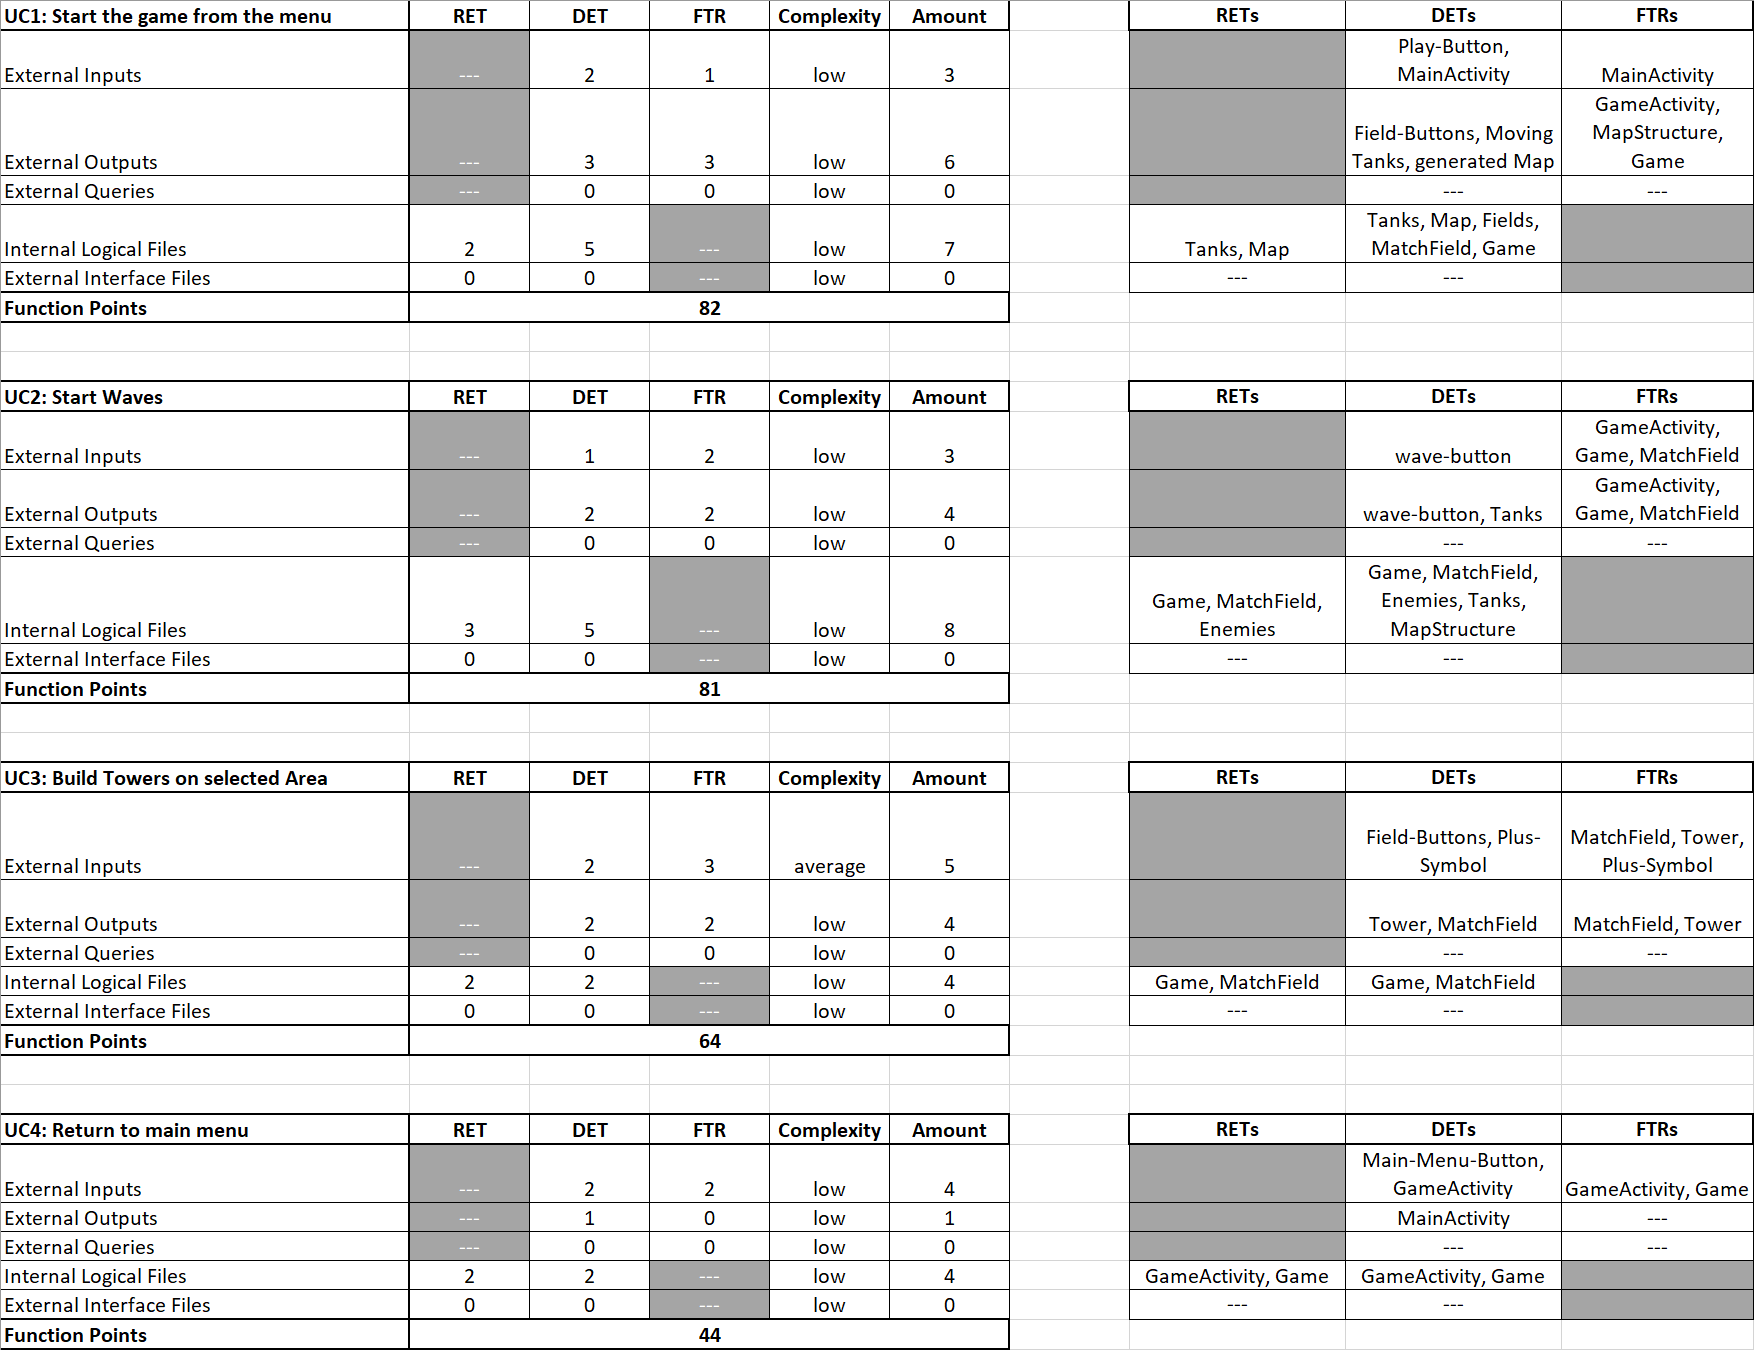
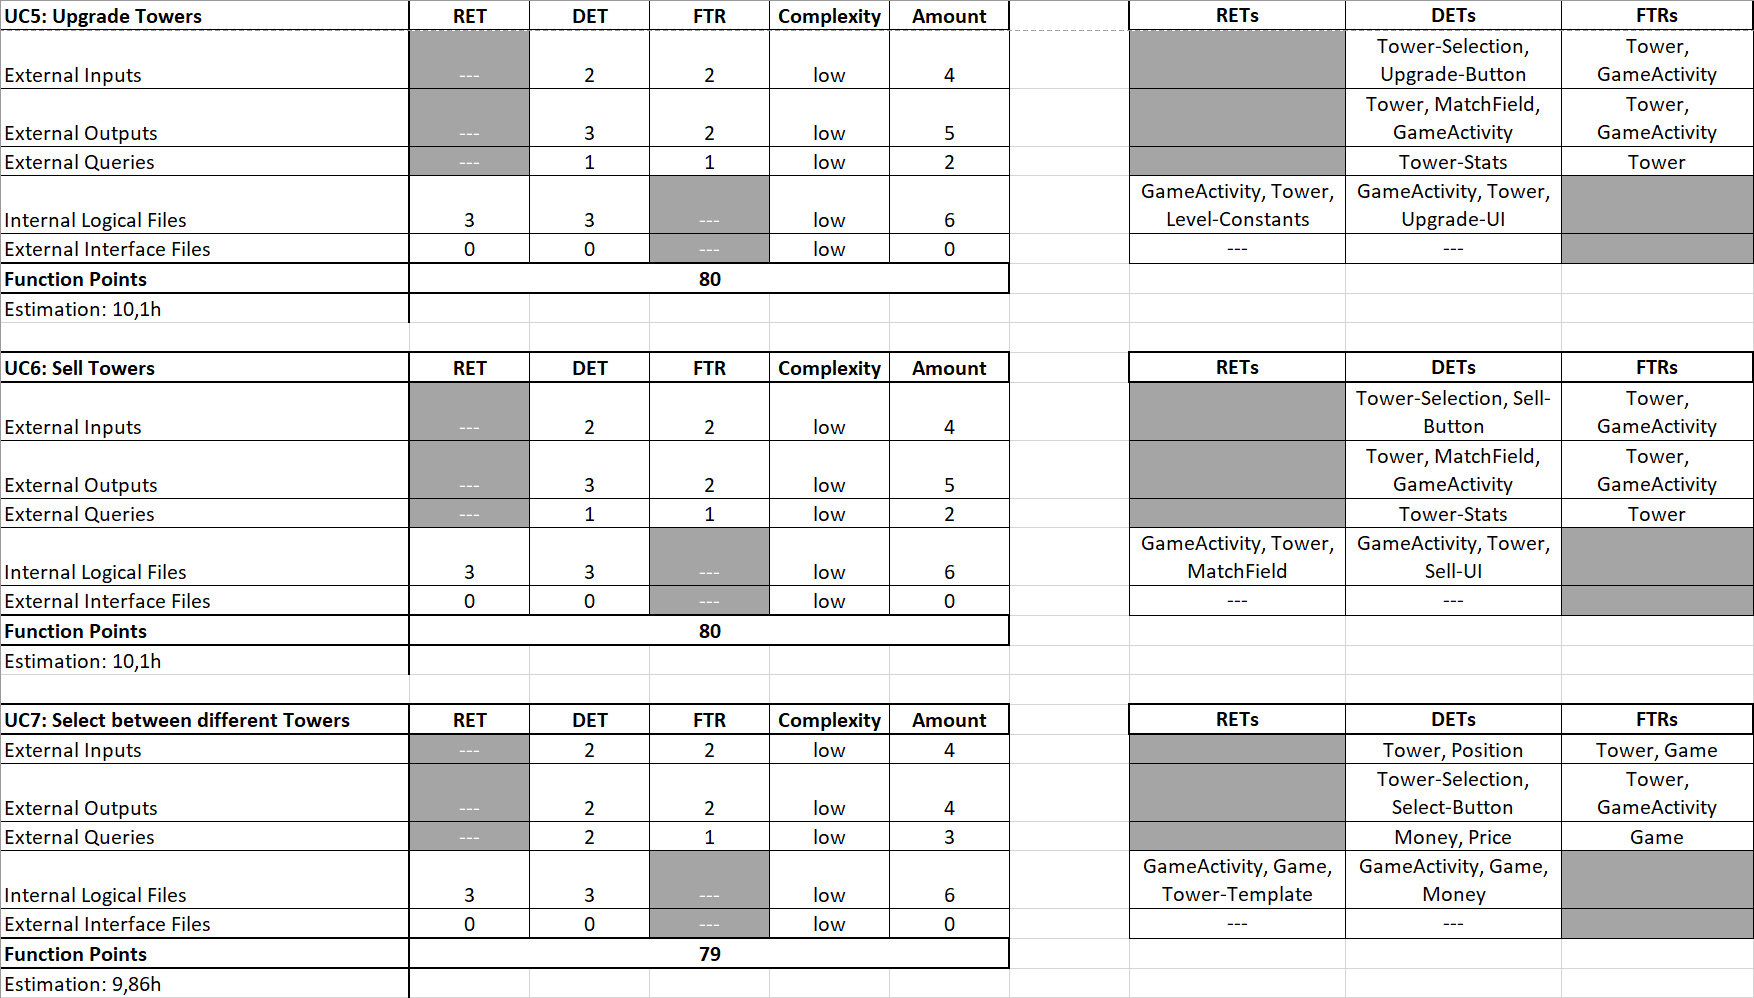
Depending on the category, RETs (Record Element Types), DETs (Data Element Types) or FTRs (File Type References) need to be analyzed according to a use case and the results should be listed in an overview table. Moreover, one can conclude a complexity out of the gained values as demonstrated in the table on the right.
Using the function points calculator "TINY TOOLS", function points can be calculated based on the analyzed data.
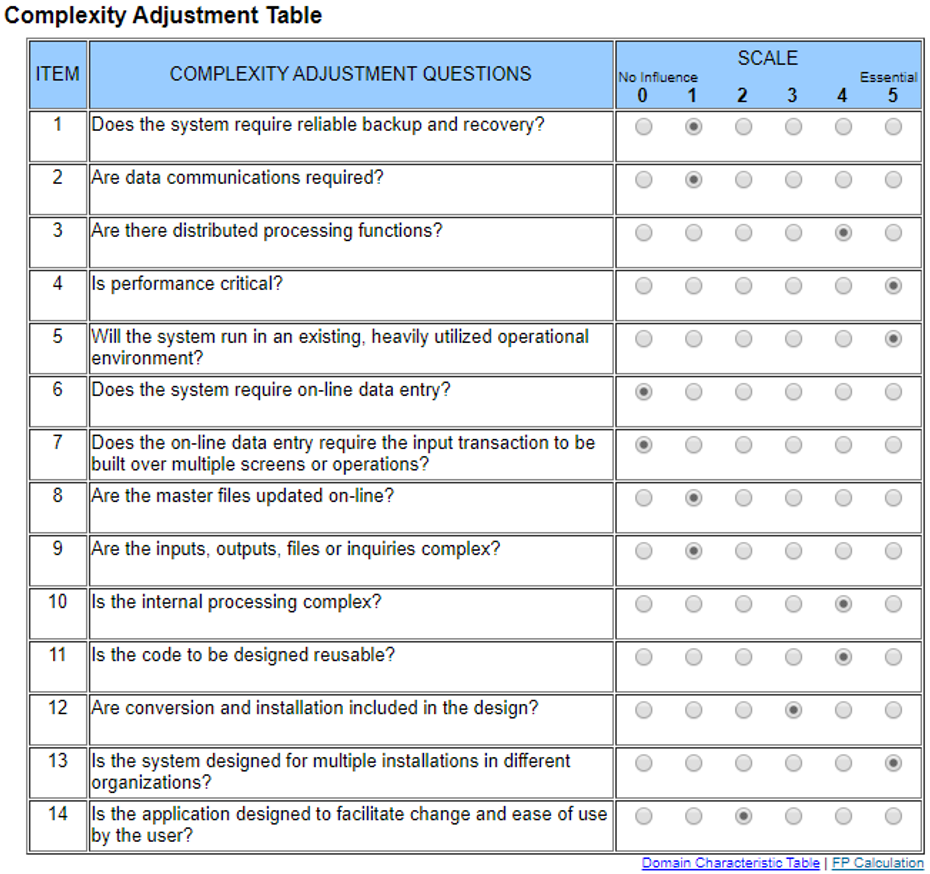
Below, you can see our function point calculations of the first 4 use cases (last semester) and of the current 6 use cases (this semester). Those have been calculated with our complexity adjustment table (on the right).
(The original function points excel table can be viewed on GitHub).
Cumulated Flow Chart

Time Estimation
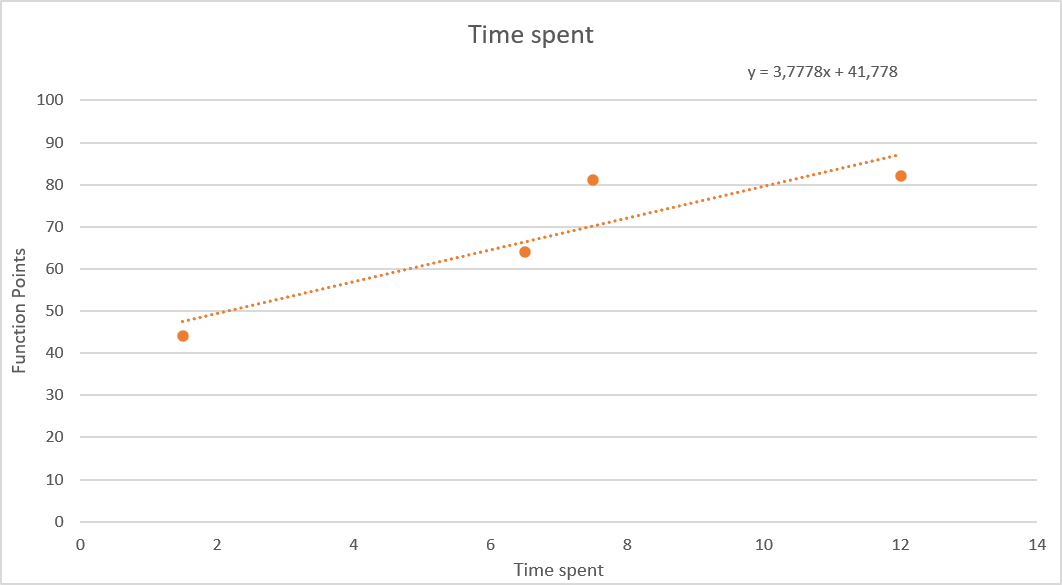
As you can see in our cumulated diagram above, our working-speed is very high at the moment in contrast to the last semester. Although we expect to not keep this speed up (due to exams and rising workload in other lectures), it is probable that all our use cases could become finished in a basic way within four to six weeks. This is the result of our calculations based on the values which one can see in the chart on the right.
If we are able to stick to this plan, we will use the remaining time for optimizations, improving the performance and getting the app ready for publication.
Progress Gameengine
Since we are still at the beginning of the semester, we have more time then usual when exams are getting closer. Thats why we do the sprints with a big workload and our app begins to grow. The priority for the nexts weeks is to get our defined Use Cases implemented and have a well working game at the end of the month. Because we also want to have enough time for the design and to adjust the right difficulty in the game, so that users are not bored after some time. For now we can say there is a big progress we made over the last days and some UCs are almost finished.
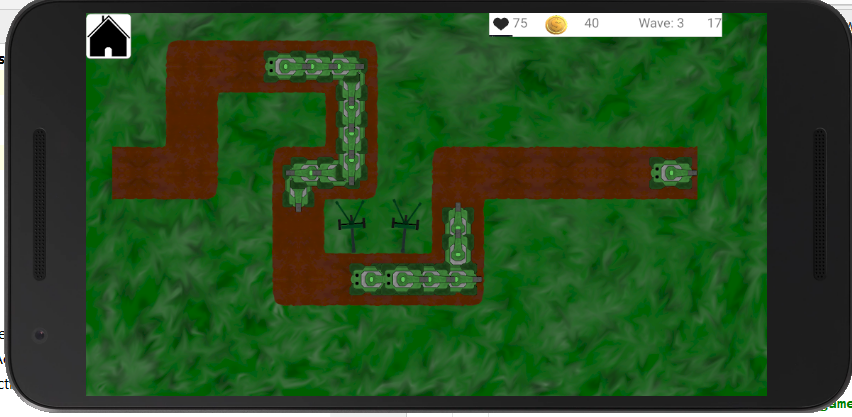
One finished functionality/feature we achieved this week is our status bar. You can see it in the picture below. This bar shows the current state of the game. This includes the lifepoints, the current money and and also some information about the waves, like the wave number and the time until the next waves starts. Looks like an easy job right? Thats not quite true, because of some big changes we did in the background. Of course, if you buy, sell or upgrade a tower you need to have a possibility to change the amount of money in a consitent way. If you kill enemies, they have to drop some money. And if an enemy passes the target it has to decrease the players lifepoints. Lifepoints also gave us the possiblility to win or lose the game, which was not defined yet. Another hidden but impemented feature is our concept of waves and matches. A wave consist of a list of enemies, where every enemy can be of a different level ore type, as well as information about spawnrate. The whole Match exists of a list of waves and further information but we need also an efficient way to compose a match or rather each wave of it. To have a consitent model we used abstract classes and we also work on some refactorings. In summary we build a little framework to make our next steps in implementation more easy. But the current state already made the game kind of playable. So that were just a few words of our current work. There may be some very cool updates in the next weeks! 🙂

Hey guys,
your blog entry looks very nice and thought out. You pointed out your calculations very detailed and the screenshot of your game is giving an overview how you progressed so far and it looks amazing! I hope you can progress like this to reach your goals.
Keep up your good work,
Team LogicGame
Hi Team LogicGame,
thank you for the positive feedback!
Because of our progress concerning the game engine, we expect to present many more features to you very soon :)!
Kind regards,
Nicolas
Hi,
your blogpost seems to meet the grading criteria but I think the Cumulated Flow Chart should show the time per workflow eg. implementation deployment etc. so that you can estimate the ratio between coding and everything else.
yours MAPHYNN
Hi Team MAPHYNN,
thank you for your feedback and for the hint concerning the Cumulated Flow Chart.
Sadly, our project management tool (Jira) does not support the generation of a cumulated flow chart with a workflow-view.
In a few weeks, we are going to publish several pie-charts instead which offer more detailed data (also concerning the workflow, phase etc.).
Kind reagrds,
Nicolas
Hello Tower Defense Team,
you have a very in detailed description on how you calculated your function points! No matter how hard we look, we cannot find anything to criticize in this post, except for maybe more details about the use cases themselves.
Keep up the great work!
Regards,
The Gyrogame team
Hi Team Gyrogame,
thanks for your feedback!
I understand your aspect concerning the details of our use cases.
So far, we tried to specify the use cases as detailed as possible, but as we are developing a game in which all components interact with each other anyhow, more detailed specifications could have restricted our progress. We hope that our use cases are understandable nonetheless :).
Kind regards,
Nicolas